Zigzag Bands Trend Follower
Another experiment with combining favourite concepts. In this algorithm, we build a trend-following method based on Bollinger Band/Keltner Channel/Donchian Channel-based Zigzags. Further experiments with strategy have shown us that this is a very promising method to explore further.
Link to the Indicator: Zigzag Bands Trend Follower
Process - Zigzag Bands Trend Follower
We defined a new method to derive a zigzag last month - which is called Channel-Based-Zigzag. This script is an example of one of the use cases of this method.
Trend Following
Defining a trend-following method is simple. The basic rule of trend following is Buy High and Sell Low (Yes, you heard it right). To explain further - methodology involves finding an established trend that is flying high and joining the trend with proper risk and optimal stop. Once you get into the trade, you will not exit unless there is a change in the trend. Or in other words, the parameters which you used to define the trend has reversed and the trend is not valid anymore.
A few examples are:
🎯 Using bands
When the price breaks out of upper bands (for example, Bollinger Band, Keltner Channel, or Donchian Channel), with a pre-determined length and multiplier, we can consider the trend to be bullish and similarly, when the price breaks down the lower band, we can consider the trend to be bearish.
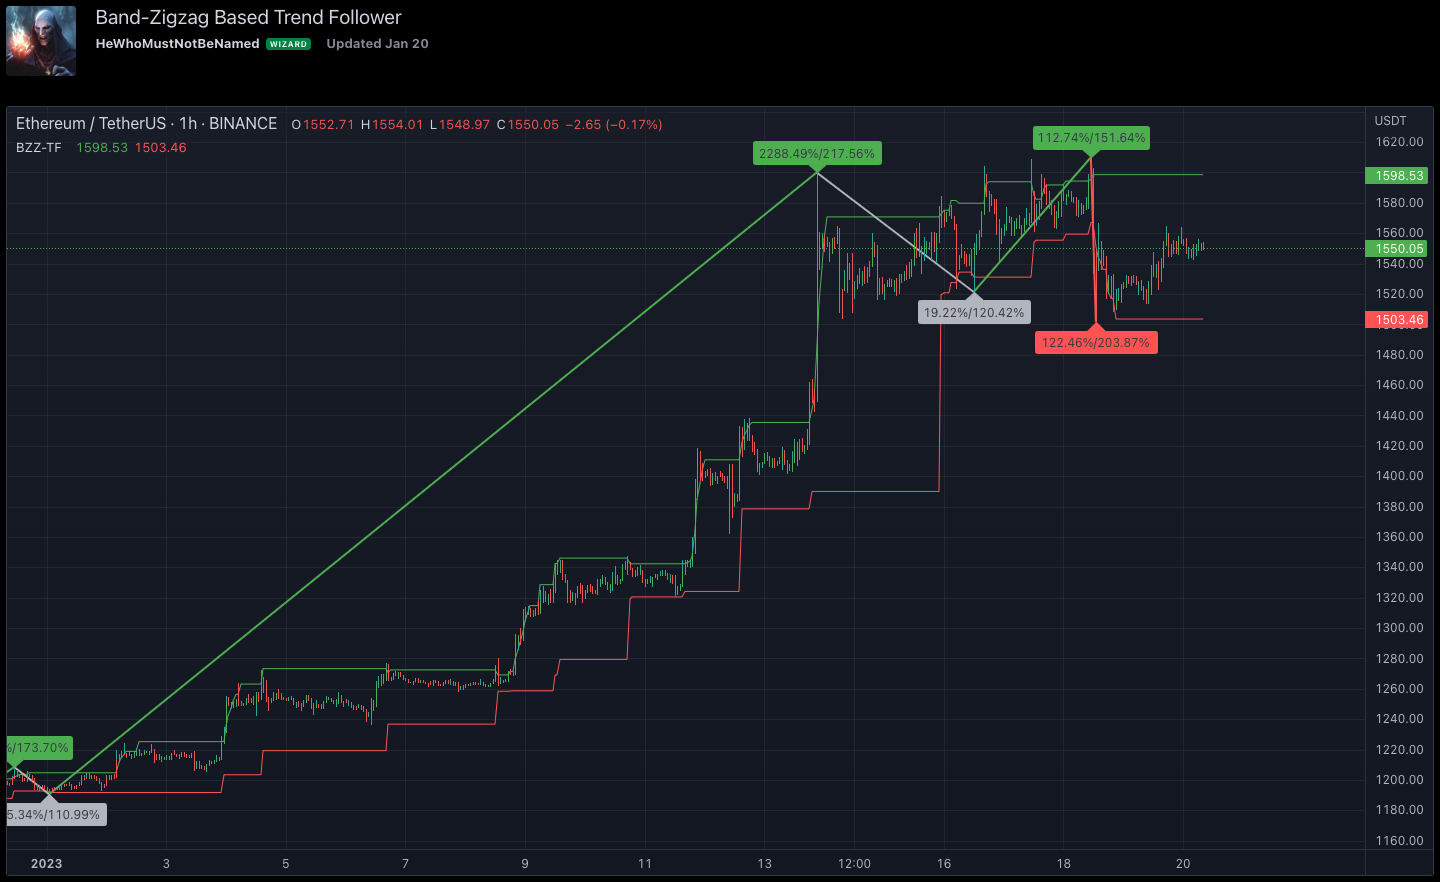
Here are a few examples where I have used bands for identifying trend
🎯 Using Pivots
Simple logic using a zigzag or pivot point is that when the price starts making higher highs and higher lows, we can consider this as an uptrend. And when the price starts making lower highs and lower lows, we can consider this as a downtrend. There are a few supertrend implementations I have published in the past based on zigzags and pivot points.
The drawback of both of these methods is that there will be too many fluctuations in both cases unless we increase the reference length. And if we increase the reference length, we will have a higher drawdown.
Band-Based Zigzag Method
Band Based Zigzag will help overcome these issues by combining both methods.
- Here we use bands to define our pivot high and pivot low - this makes sure that we are identifying trends only on breakouts as pivots are only formed on breakouts.
- Our method also includes a pivot ratio to cross over 1.0 to be able to consider it as trend. This means we are waiting for the price also to make a new high high or lower low before making the decision on-trend. But, this helps us ignore smaller pivot movements due to the usage of bands.
- I have also implemented a few tricks such as sticky bands (Bands will not contract unless there is a breakout) and Adaptive Bands (bands will not expand unless the price is moving in the direction of the band). This makes the trend-following method very robust.
- To avoid fakeouts, we also use percentB of high/low in comparison with price retracement to define breakout.
The indicator
The output of the indicator is simple and intuitive to understand.
🎯 Trend Criteria
- Uptrend when last confirmed pivot is pivot high and has a higher retracement ratio than PercentB of High. Else, considered a downtrend.
- Downtrend when last confirmed pivot is a pivot low and has a higher retracement ratio than PercentB of High. Else, considered an uptrend.
🎯 Settings
Settings allow you to select the band type and parameters used for calculating zigzag and then trend. Also has few options to hide the display.
Comments