Recursive Reversal Chart Patterns
An advanced technical indicator that scans for reversal chart patterns - Double Tap, Triple Tap, Cup and Handle, Head and Shoulder patterns
Link to the Indicator: Recursive Reversal Chart Patterns
Recursive Reversal Chart Patterns Indicator
Welcome to another exploration of Zigzag and Pattern ecosystem components. Previously we derived Pitchfork and Recursive Zigzag indicators. This indicator is designed to scan and highlight a few popular "Reversal Chart Patterns". Similar to other indicators in the ecosystem, this too is built on recursive zigzags.
- Double Taps
- Triple Taps
- Cup and Handles
- Head and Shoulders
The indicator however names the patterns separately for bullish and bearish formations. So, the actual names you see on the screen are
- Double Top
- Double Bottom
- Triple Top
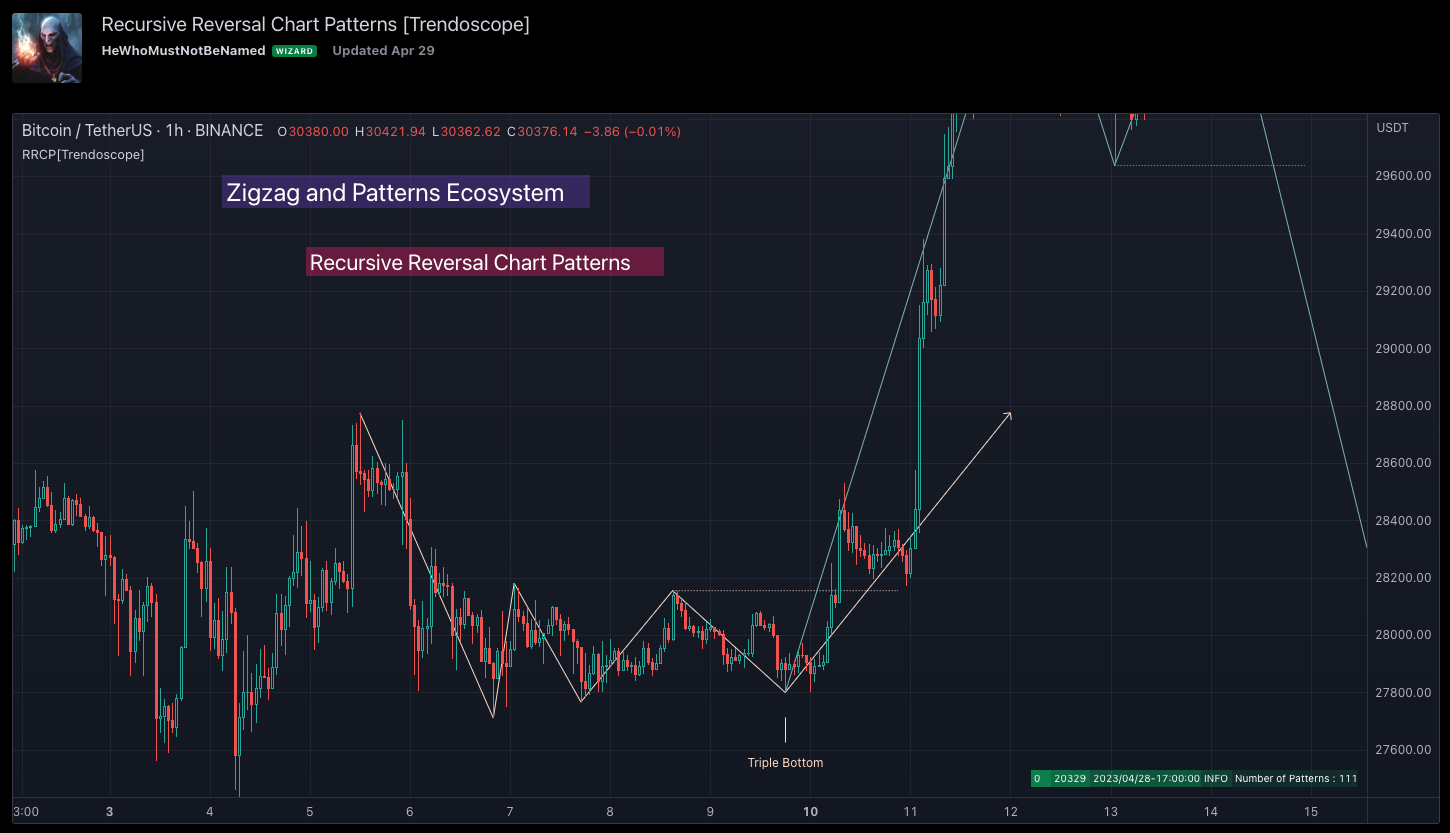
- Triple Bottom
- Cup and Handle
- Inverted Cup and Handle
- Head and Shoulders
- Inverse Head and Shoulders
Here is a snapshot of how each category of patterns looks on the chart.
Architecture using Zigzag and Pattern Ecosystem
Many of you may be cursing me for publishing too many libraries. But, these are all preparations for something big. Like other indicators in the Zigzag and Patterns Ecosystem, this too uses a bunch of libraries.
🎯Major direct dependencies
🎯Indirect dependencies
🎯Minor dependencies
Indicator Settings
Generic and Zigzag Settings.
Note: In case of timeout, please decrease the value of the depth parameter
Pattern Selection
Having all the patterns selected on the chart may also cause timeouts and will make the chart look messy. It is better to limit one or two patterns on the chart to have a clear picture.
Scanner Settings
Scanner Settings
Indicators
These are options to use indicators as secondary confirmation to calculate divergence. If selected, the patterns are shown only if the divergence data is inline. The option is also available to plugin external indicators. These calculations are not straightforward and not easy to measure by manual inspection. This feature at present is purely experimental.
Comments