Auto Harmonic Projection Ultimate
Auto Harmonic Projections is one of premium indicators that can help users identify potential patterns on the chart before they are formed.
Link to the indicator: Auto Harmonic Projection - Ultimate
What is Auto Harmonic Projection Indicator?
Lets have a quick look at what is Auto Harmonic Projection indicator and how it is different from Auto Harmonic Pattern UltimateX (Our most popular Harmonic Pattern Indicator)
- Unlike Auto Harmonic Patterns Ultimate, instead of scanning whole XABCD for harmonic pattern, this script only collects XABC and projects PRZs (Possible D zones)
- Once possible patterns are found, lines are drawn to connect XABC and boxes to project PRZs. There can be more than 1 PRZs for XABC combination. If PRZs of multiple patterns overlap, they are joined and shown as single PRZ where all patterns are listed against it.
- If price crosses C, pattern is considered as failed and will be removed from the chart. Please note that failed projections are very common. Projections are only considered valid after the price cross validation point as set by the users via settings.
- Validation point/Or the Activation Point is calculated based on the user settings. It is either the price level of B or calculated based on user provided fib ratios of C and the start of the projection.
- Projection is considered as complete when the start of PRZ range is reached. When this happens, a trailing stop called - reversal price is activated on the projections. Projection will remove on the chart until the reversal price is hit.
- Projections often take long time and get stuck between invalidation price and activation price. Or get stuck in between target price and invalidation price. When this happens, the projections are removed from the chart. But, they will remain in the backend for further calculations till the patterns are closed.
- A projection can result in multiple PRZ ranges. Each range is displayed as box with separate range pattern labels. However, the projections will not actively track individual projections.
Deep dive into Auto Harmonic Projections
Patterns Included
- Classic Patterns
- Gartley
- Bat
- Butterfly
- Crab
- Deep Crab
- Cypher
- Shark
- Nenstar
- Anti Patterns
- Anti Nenstar
- Anti Shark
- Anti Cypher
- Anti Crab
- Anti Butterfly
- Anti Bat
- Anti Gartley
- Navarro200
- Non-Standard Patterns (Disabled by default)
- Five-Zero
- Three Drives
- White Swan
- Black Swan
- Sea Pony
- Leonardo
- 121
- Snorm
- Total
Indicator Components of Auto Harmonic Projections
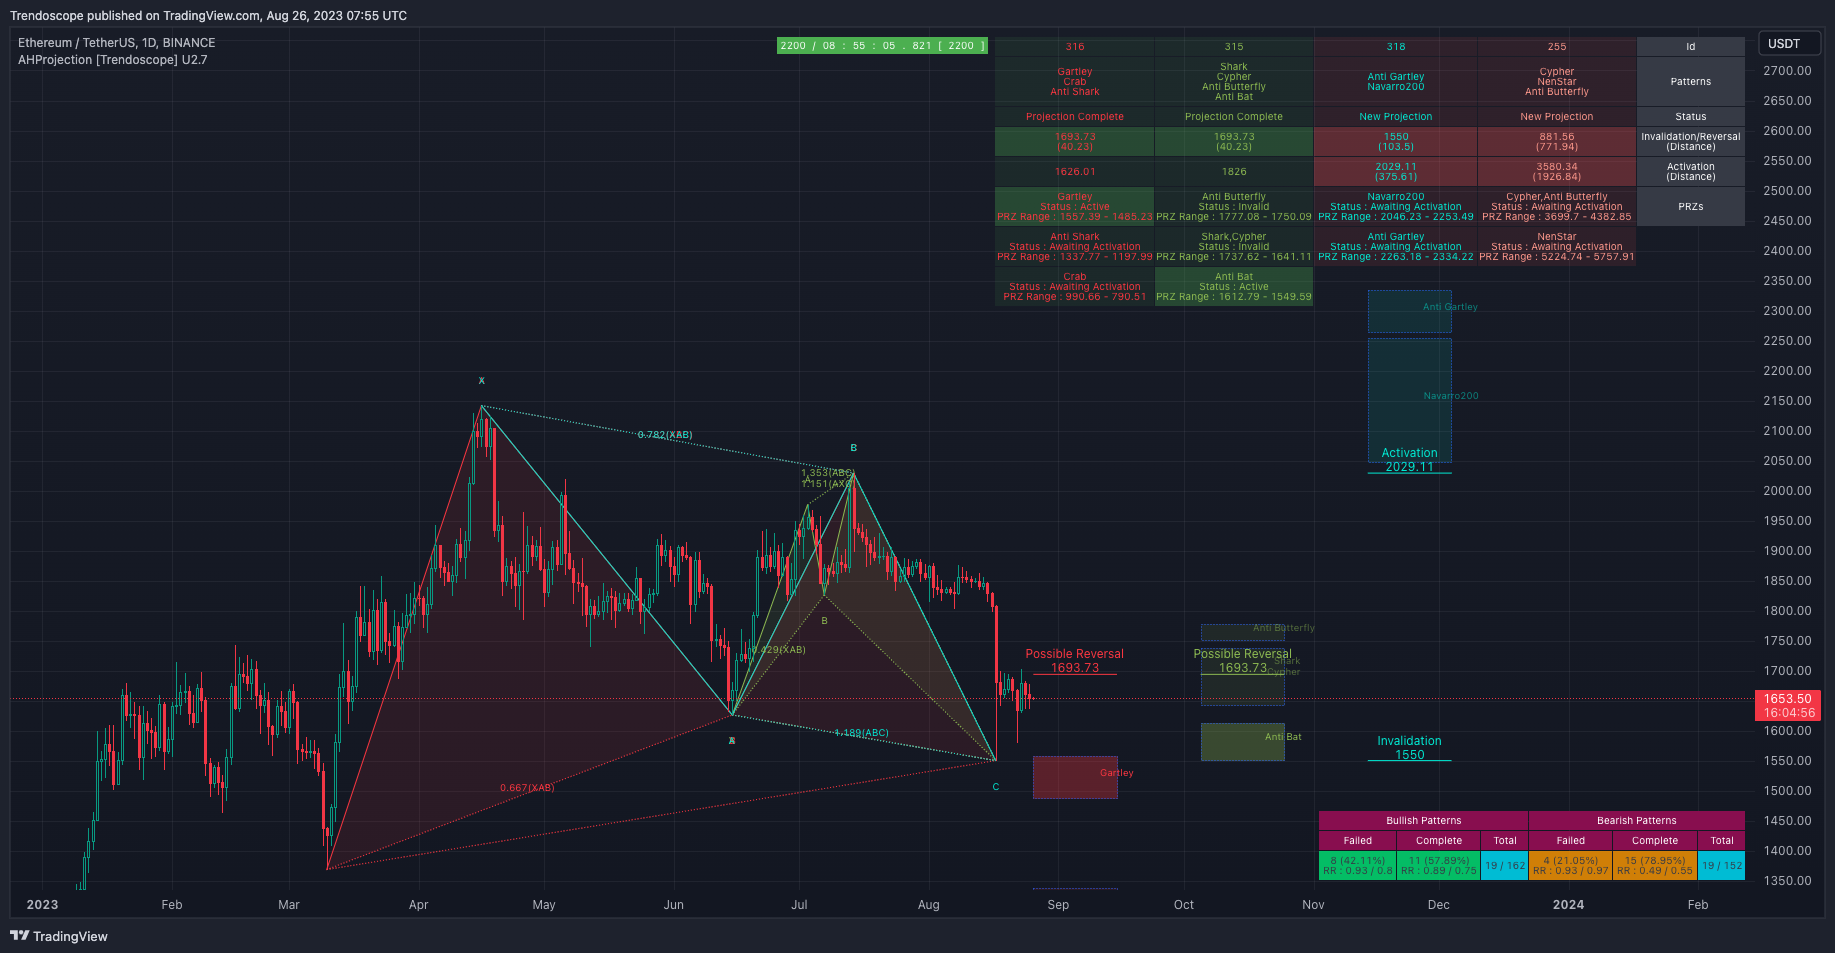
When Auto Harmonic Projection Indicator is loaded on the chart, users will see following components.
- Projection Drawings on the chart - Please note that projections do not need to be on the chart all the time. Projections appear when price makes the potential patterns.
- Calculated Activation/Invalidation/Reversal/PRZ levels - These levels are calculated based on the input settings.
- Open Projections Table - this is a tabular representation of the data present on charts.
- Closed Projection Stats - This table provides detailed stats of all the projections that occurred in the past for specified number of bars. The time for which details are recorded can be seen in the run timer widget on the top middle part of the chart.
Indicator Components - More Details
Lets get to the details of the indicator components discussed earlier.
Projection Drawings on the Chart
Each projection formed on the chart will be color coded so that all the details with respect to given projection appear on the same color. This design can help differentiate the extensive data presented on the screen that may have more than one projections active at a time.
Color of the patterns are randomly chosen and are dependent on the Theme input settings. If the chart is dark themed, users need to select the dark theme from input settings and if the chart is light themed, then users need to select the light theme from the input options. This will allow appropriate colors to be chosen for the projections that are drawn on the chart.
Calculated Levels
These levels are calculated based on the user input settings. Details of them are as follows
- Activation Level is the calculated price after which the projection is considered Valid or Active. If price reaches invalidation level before reaching Activation, then the projection is considered as invalid. Activation Levels are shown only when until they are reached. Once activation is reached, they are removed from the chart and the nearest PRZ box is highlighted as that will be the next target for the price.
- Invalidation Level is the price at which the projection is either considered as invalid or failed. Projection is invalid if it reaches the invalidation level before reaching the activation level. If projection reaches invalid level after reaching the activation level, then it is considered as a failed projection. Invalid levels are shown until price reaches the nearest PRZ box. After reaching PRZ, Invalidation level is removed from the chart and instead the algorithm displays the Reversal Level.
- Reversal Level will only appear after a projection is complete by reaching the first PRZ zone. When price hits the nearest PRZ level, the projections then will become patterns. Drawings are kept on the chart until reversal levels are breached. Reversal levels are recalculated based on C and D levels. Hence, it acts as a trailing stop for a trade placed against the projection and also acts as a validation price for the completed pattern for reversal.
- PRZ zones can be one or many for each projection. Each PRZ zone will display as color coded boxes along with the list of patterns corresponding to each PRZ.
Open Projection Details Table
Open projection details table is a snapshot of projection data on tabular format. Users can find following details in this table.
- Id - Unique Auto Incremented Projection Id generated for each projection.
- Patterns - All the projected patterns for a projection. This is union of all the patterns for different PRZs identified in each projections.
- Status - Projection status can be one of the following
- New Projection - Projection is just formed and yet to cross validation/activation price.
- Projection Active - Price has reached validation/activation price post formation of projection. But, yet to reach any of the PRZs
- Projection Complete - Price has reached at least 1 PRZs of the projection
- Invalidation/Reversal - This field shows invalidation price if the projection is either in new or active state. If projection is complete, it will show Reversal level. Live distance from current price to these levels are also shown in the brackets.
- Activation - This is the calculated activation level for each projection. The field is highlighted when projection is in new status. Once the projection is active, the activation level is not used anymore. Hence, the highlight will be removed.
- PRZs - Potential reversal zones are calculated based on Harmonic Pattern rules for different patterns. There can be multiple PRZs for each projection. When projections of different patterns overlap, they will be combined into single PRZ. Hence, some of the entries may show multiple pattern names whereas the others may show single pattern name. PRZs can further have following statuses. These are different from Projection status. Projection status tracks projection as whole whereas PRZ status will track each individual PRZ.
- Awaiting Activation - Price has not reached PRZ level yet.
- Active - Price has reached the PRZ level and is either in the zone or reversing.
- Invalid - Price has reached the PRZ zone and also has gone further out of the PRZ zone.
Closed Projection Stats
Closed projection stats table gives users the details about how historical patterns has performed. At present, this data does not have pattern specific stats. But, separate details are presented for bullish and bearish patterns.
Please note the definition of following terms.
- Valid Projection - Projection that has hit validation/activation point after formation.
- Invalid Projection - Projection that has hit invalidation point before reaching validation/activation point.
- Total - Sum of Valid and Invalid Projections.
- Failed Projections - Projections that are valid but reached invalidation point before completion.
- Completed Projections - Projections that has at least reached one PRZ.
Following Details are presented in the table for Failed, Complete and Total Projections for Bullish and Bearish sides.
- Number of Failed/Completed Projections: The absolute number of failed and completed projections.
- Percentage of Failed/Completed Projections: The Percentage is taken with respect to Valid Projections.
- Median and Average Risk Reward: Risk reward calculated based on historical projections. The calculation is based on Active Price as entry, invalidation price as stop and start price of the PRZ as target.
- Total and Valid Projections: Total field contains the number of valid projections and total number of projections formed.
Auto Harmonic Projection Settings
The indicator provides detailed settings to control every aspects. Users will have full control to experiment and perform on their research on the methodologies involving Harmonic Projections. Below are the detailed descriptions of each settings included in the indicator.
Tooltips are provided for each of the input settings field to describe them in efficient manner.
Generic Settings
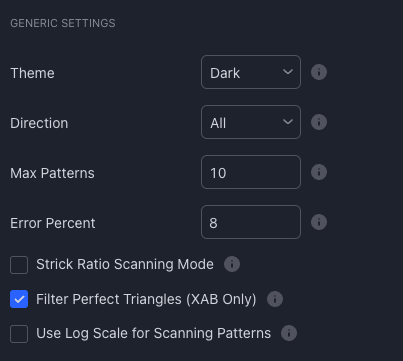
These properties are generic in nature and does not belong to other major categories of settings listed afterwards. This include.
- Theme - Chart theme settings. Line and label colors are generated based on the theme settings. If dark theme is selected lighter colors are used and if light theme is selected, darker colors are used.
- Direction - Use this to filter only bullish or bearish projections. Please note that the trade direction of bullish projection is short and that of bearish projection is long
- Max Patterns - Max number of projections allowed on chart at any time. If exceeds, the oldest pattern on chart will be removed. But, they are still kept in memory and continue to generate alerts and perform other calculations.
- Error Percent - Error threshold for calculation on projections. Increased error threshold will reduce the accuracy of projections. Lower error threshold will reduce number of projections detected.
- Strict Scanning Mode - If selected, the error thresholds are not added when the from-ratio and to-ratio of the projection are different. This will lead to more accurate projections however less number of projections will be scanned.
- Perfect Triangles - If enabled, only projections where price has not crossed XB (Perfect looking triangles) will be picked
- Use Log Scale - Use log scale instead of linear scale for scanning patterns
Zigzag Settings
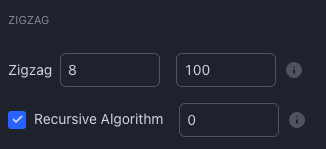
Zigzags are basic building blocks for any pattern scanning algorithms. The selection greatly impacts the size and type of patterns being scanned.
Users can use either recursive zigzag algorithm or deep search algorithm. Both highly depend on zigzag depth parameter. In recursive zigzag, you can also select the level of zigzag to be used for scanning projections.
Filters
Filters further allow users to be more selective and select the patterns of their choice or their condition. By default all the filters are disabled. Filters available in this indicator are of following types.
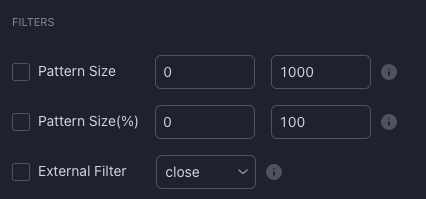
- Size - Filter based on number of bars the projection is spawning.
- Size(%) - Filter based on the size in terms of price.
- Custom External Filter - Define your filter script and use them with the indicator. Example filters can be found in the Filters Page
Further, below video demonstrates how to define and use external filters.
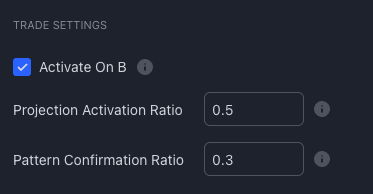
Trade Settings
These settings influence the calculation of different trade levels - Activation Level, Reversal Confirmation Level.
- Activate On B - Enabling this will use B as activation level. But, only when B is placed between C and D levels. In some patterns D appear before B (BCD ratio less than 1). In such cases, this setting will be ignored will continue to use Projection Activation Ratio
- Projection Activation Ratio - This is a fib ratio to use for calculation of Activation Level. Activation level is calculated based on distance between C and D (Starting value of Projection Range). Value of 0.5 means the activation is placed at 50% of C and D.
- Reversal Confirmation Ratio - Also called as Pattern Confirmation ratio. This level is calculated based on fib retracement of CD. If pivot D keeps extending, the reversal level keeps trailing them. When price hits this level, theoretically it can infer that the reversal is confirmed.
Pattern Selection Settings
This section includes both category and individual pattern based selection that allows users to filter out what pattern projection they want to see on the charts.
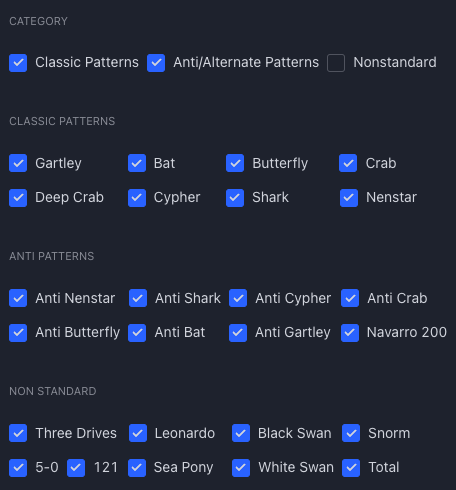
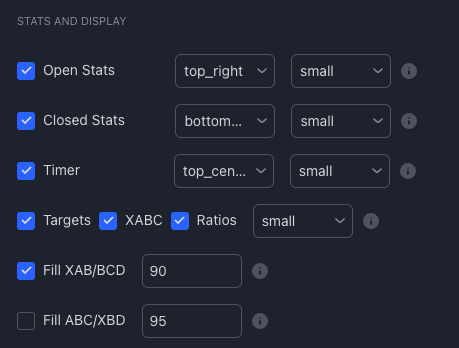
Stats and Display
This section contains display related controls. Overall provides option for users to enable/disable, control display position, size and fill of following attributes
- Open Projections
- Closed Stats
- Timer
- Targets
- XABC Pivots
- Ratios
- Fill Levels of major and minor triangles
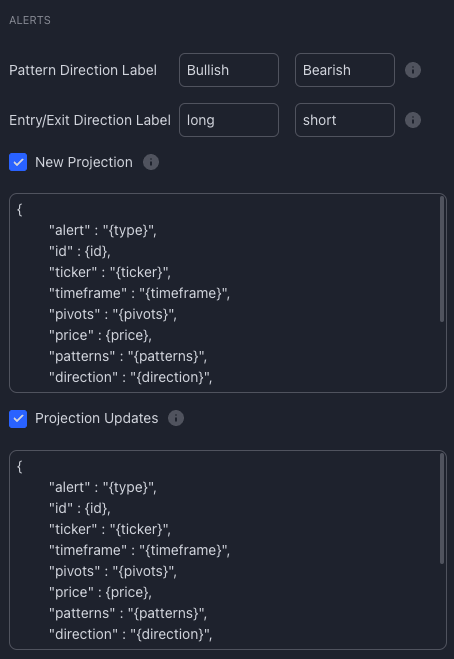
Alerts
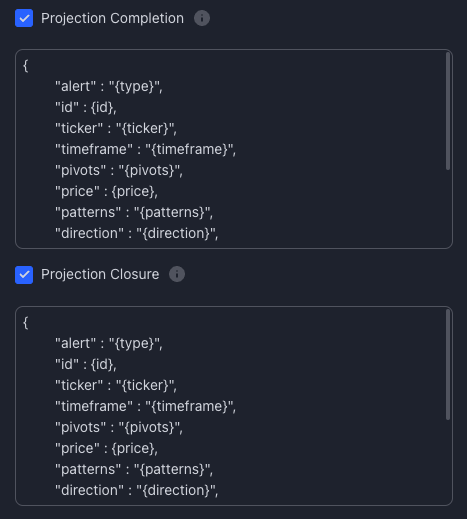
Alerts are fully customisable and the indicator provides following placeholders that can help users to customise their alerts.
- {type} - Alert type
- {id} - Auto generated unique id of projections
- {ticker} - Symbol on which the projections are formed.
- {timeframe} - The chart timeframe on which the alerts are triggered.
- {basecurrency} - Base Currency of the symbol. Applicable for forex and crypto.
- {quotecurrency} - Quote Currency of the symbol. Applicable for forex and crypto.
- {pivots} - Pattern pivots - XABC
- {price} - Current price
- {patterns} - List of patterns identified
- {direction} - Pattern direction (Not trade direction). The values for this come from another custom field - "Pattern Direction Label"
- {entrydirection} - For Harmonic Projection, this is generally the opposite of pattern direction. For example, entrydirection for bullish patterns will be short and the same for bearish patterns will be long. This is because the projections are measuring the completion of patterns from C to D.
- {exitdirection} - exit direction will be the opposite of entry direction. Both entry and exit direction labels are controlled by another custom field - "Entry/Exit Direction Label"
- {przstart} - This is the starting value of consolidated Projection ranges.
- {przend} - This is the ending value of consolidated Projection ranges.
- {activationprice} - Calculated activation price based on the trade settings.
- {invalidationprice} - This is generally equal to the price of C pivot.
- {reversalprice} - Available only after a projection is complete. Signifies calculated reversal confirmation price of completed Harmonic Pattern.
- {laststatus} - Previous state of the projection.
- {status} - Current state of the projection.
- {result} - Only available for Projection closure alert. Tells the result of the projection
Types of Alerts
For each type, text fields are provided with default template that can be further edited by the user.
- New Projection
- Projection Updates
- Projection Completion
- Projection Closure
Further details can be found in the article Customising Alerts
Comments