ABC Corrective Pattern on Recursive Zigzag
There are several implementations of ABC pattern in tradingview and pine script. However, we have made this indicator to provide users additional quantifiable information along with flexibility to experiment and develop their own strategy based on the patterns.
Link to the Indicator: ABC Pattern on Recursive Zigzag
Concept of ABC Pattern
Also known as the Corrective Wave or Zigzag Pattern, ABC Pattern is a fundamental concept in Elliott Wave Theory, which is widely used in technical analysis to identify and predict price movements in financial markets.
It is a three-wave corrective pattern that typically occurs within the context of a larger impulse or trending wave. It consists of two smaller waves in the opposite direction (A and C) separated by a corrective wave (B). These waves are labeled alphabetically and represent price movements.
Wave A (Impulse Wave): Wave A is the first leg of the pattern and is characterised by a strong price move in the opposite direction of the prevailing trend. It is often driven by a fundamental or sentiment-driven event that temporarily disrupts the trend.
Wave B (Corrective Wave): Wave B is the corrective wave that follows Wave A. It represents a partial retracement of Wave A's price movement. Wave B can take various forms, such as a simple correction or a complex correction (e.g., a triangle or a flat correction). It typically doesn't retrace the entire length of Wave A.
Wave C (Impulse Wave): Wave C is the final leg of the pattern and is characterised by a strong price move in the same direction as the prevailing trend. It often surpasses the starting point of Wave A and confirms the resumption of the larger trend.
Highlights of the ABC Indicator
Here are the important factors that distinguishes the current implementation over other ABC indicators.
- Implementation is based on recursive multi level zigzag allows bigger as well as smaller patterns to be identified
- Allows users to set their trading rules with respect to entry, target and stop ratios, experiment and build their own strategy based on the pattern.
- Back test summary including win ratio and risk reward will help users understand the profitability based on different settings being used.
Indicator Components
Chart Components
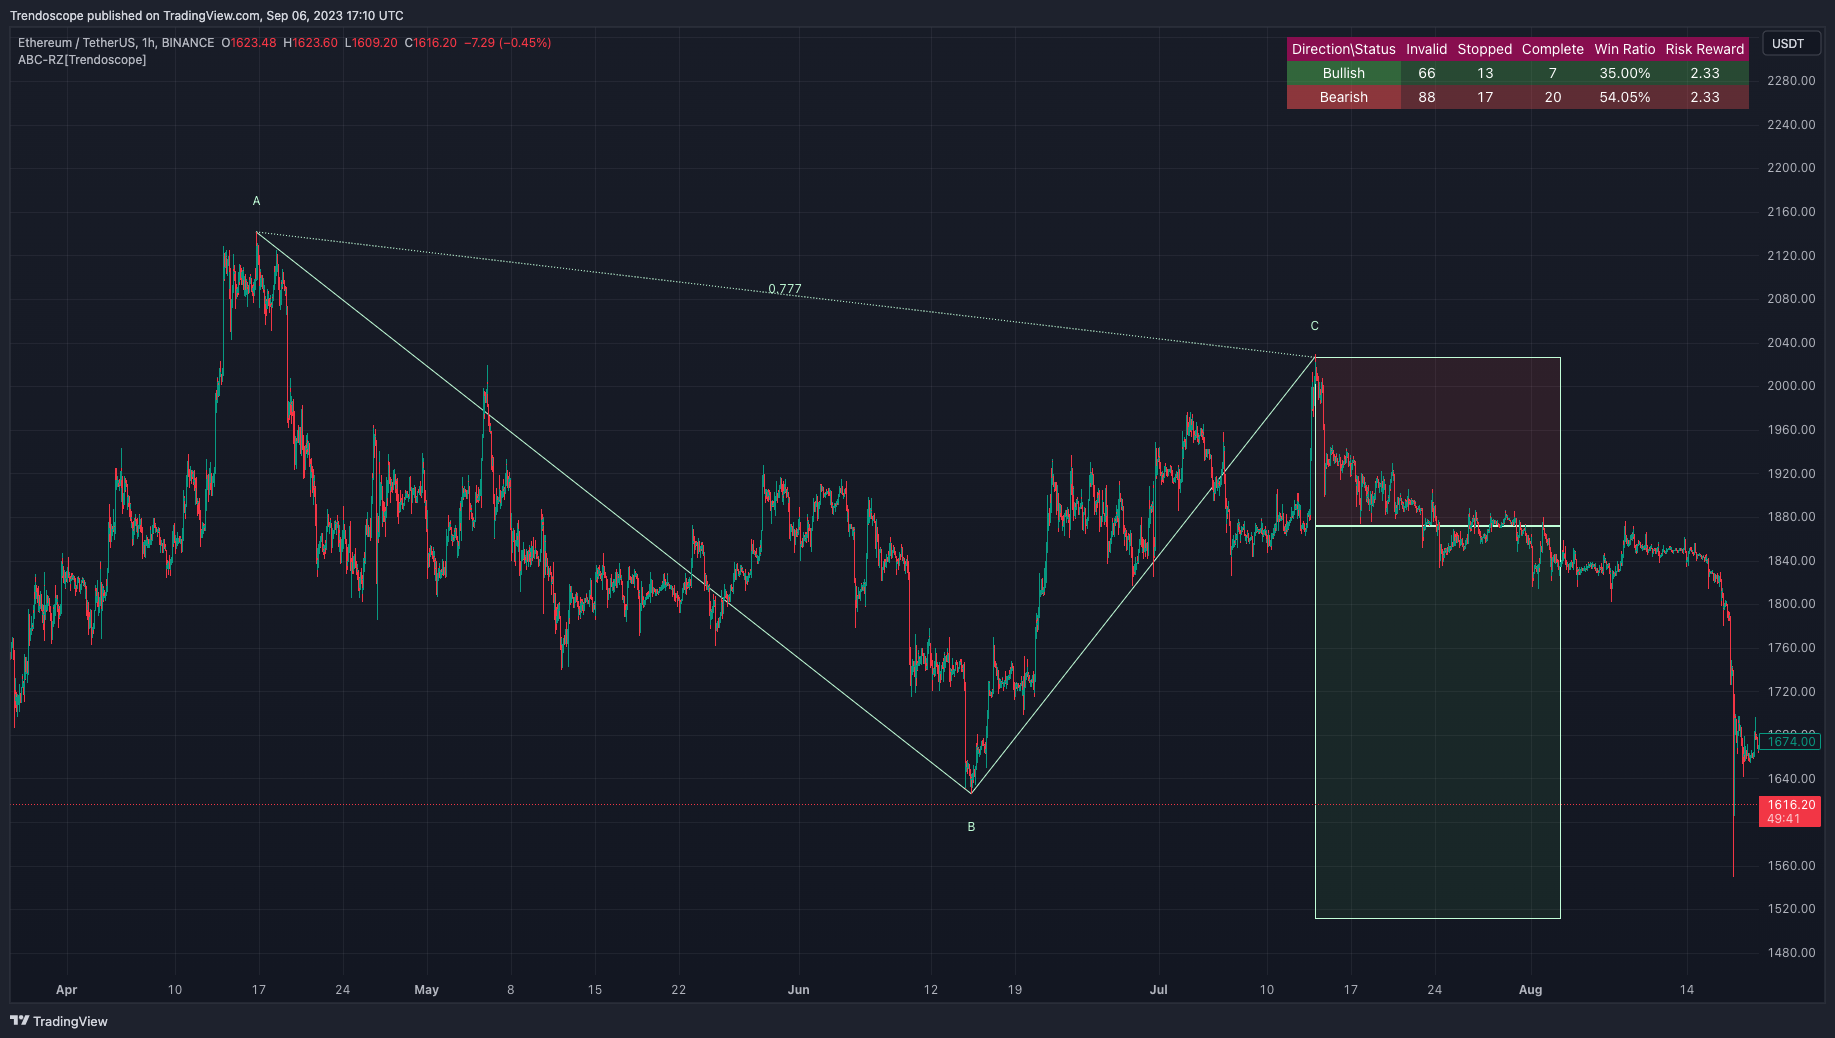
Upon loading the indicator on the chart, we can observe the following components on the chart.
- Pattern Drawings is the graphical representation of present patterns. Please note that it is not necessary for patterns to be there on the chart all the time. Patterns will appear on the chart when price makes the patterns.
- Trade Box is the box representing trade signals of the pattern. These trade levels are generated based on the user settings.
- Summary Table is the back test summary containing details of historical pattern performance including Win Ratio and Risk Reward.
Indicator Settings
Details of each user settings are provided in the tooltips. Below is the snapshot of it.
- Theme - Chart theme settings. Line and Label colors are generated based on the theme settings. If dark theme is selected, lighter colors are used and if light theme is selected, darker colors are used.
- Zigzag Length - Level 0 Zigzag Length
- Zigzag Depth - Depth of the zigzag pivots on which the recursive algorithm is applied to calculate multiple levels.
- Minimum Zigzag Level - Minimum Level to be considered for pattern recognition. Level 0 is the base level. Hence, having 0 for the setting includes all the zigzag levels calculated.
- Base - Base on which the entry, target and stops are calculated. The valid values are
- ABC Extension
- BC Retracement
- Entry/Target/Stop Ratios - These are used for calculation of entry/target/stop levels for each patterns.
- Log Scale - Allows patterns to be scanned and target calculation using log mode instead of linear mode.
- Use Close Prices - Use close prices to track the pattern trades instead of high/low prices.
- Trade Condition - This is a complex condition that allows trades to be filtered based on the trend conditions. Below are the different conditions.
- any - no filter. Include all patterns.
- trend - consider patterns if the pivots A and B are in the same direction. Meaning, for bullish pattern to be considered, pattern should have Higher Low A and Higher High B. For bearish pattern to be considered, the pattern should have a Lower High A and Lower Low B.
- reverse - consider patterns if the pivots A and B are in opposite direction. Similar to to previous condition but the opposites. For bullish pattern to be considered it should have Lower Low A and Lower High B. And for bearish pattern to be considered, the pattern should have Higher High A and Higher Low B
- contracting - consider patterns if the pattern is contracting. Meaning, both A and B are either forming Lower High or Higher Low.
- expanding - consider patterns if the pattern is expanding. Meaning, both A and B pivots are either forming Higher High or Lower Low.
ABC Pattern Indicator Settings
Alerts
Basic level of alerts are built in the script using alert function to highlight the following conditions:
- New ABC Pattern
- Updates to existing Pattern
Both conditions will alert simple text messages. There is not much customization provided as part of this indicator. We will consider providing more options in future versions based on the interest and demand shown by users.
Comments