ABCD Pattern Projection Indicator
At Trendoscope, we’ve dedicated years to exploring and developing technical analysis tools, focusing on chart patterns like Harmonic Patterns, Reversal Patterns, Elliott Waves, and more. Our expertise in these areas has led to frequent requests from traders for an indicator based on the ABCD pattern. While we initially excluded it from our Harmonic Patterns collection, creating a dedicated ABCD Projection Indicator has always been a priority. Today, we’re thrilled to share the result: the ABCD Projection Indicator, a robust tool designed to help traders identify and capitalize on trend continuation opportunities. You can explore it on TradingView here.
Link to the Indicator: ABCD Projection Indicator
What is the ABCD Pattern Projection Indicator?
The ABCD Projection Indicator is a specialized tool built to detect and project ABCD patterns using a Zigzag-based approach. The ABCD pattern, defined by alternating pivot highs and lows labeled A, B, C, and D, is a cornerstone of technical analysis, particularly in trending markets. This pattern signals potential trend continuation following deep pullbacks, offering traders a structured way to anticipate price movements.
Our indicator automates the process of identifying the ABCD Pattern Projections using recursive zigzag algorithm.
Key Features of the ABCD Projection Indicator
The ABCD Projection Indicator is designed with precision and trader usability in mind. Here’s a breakdown of its core components:
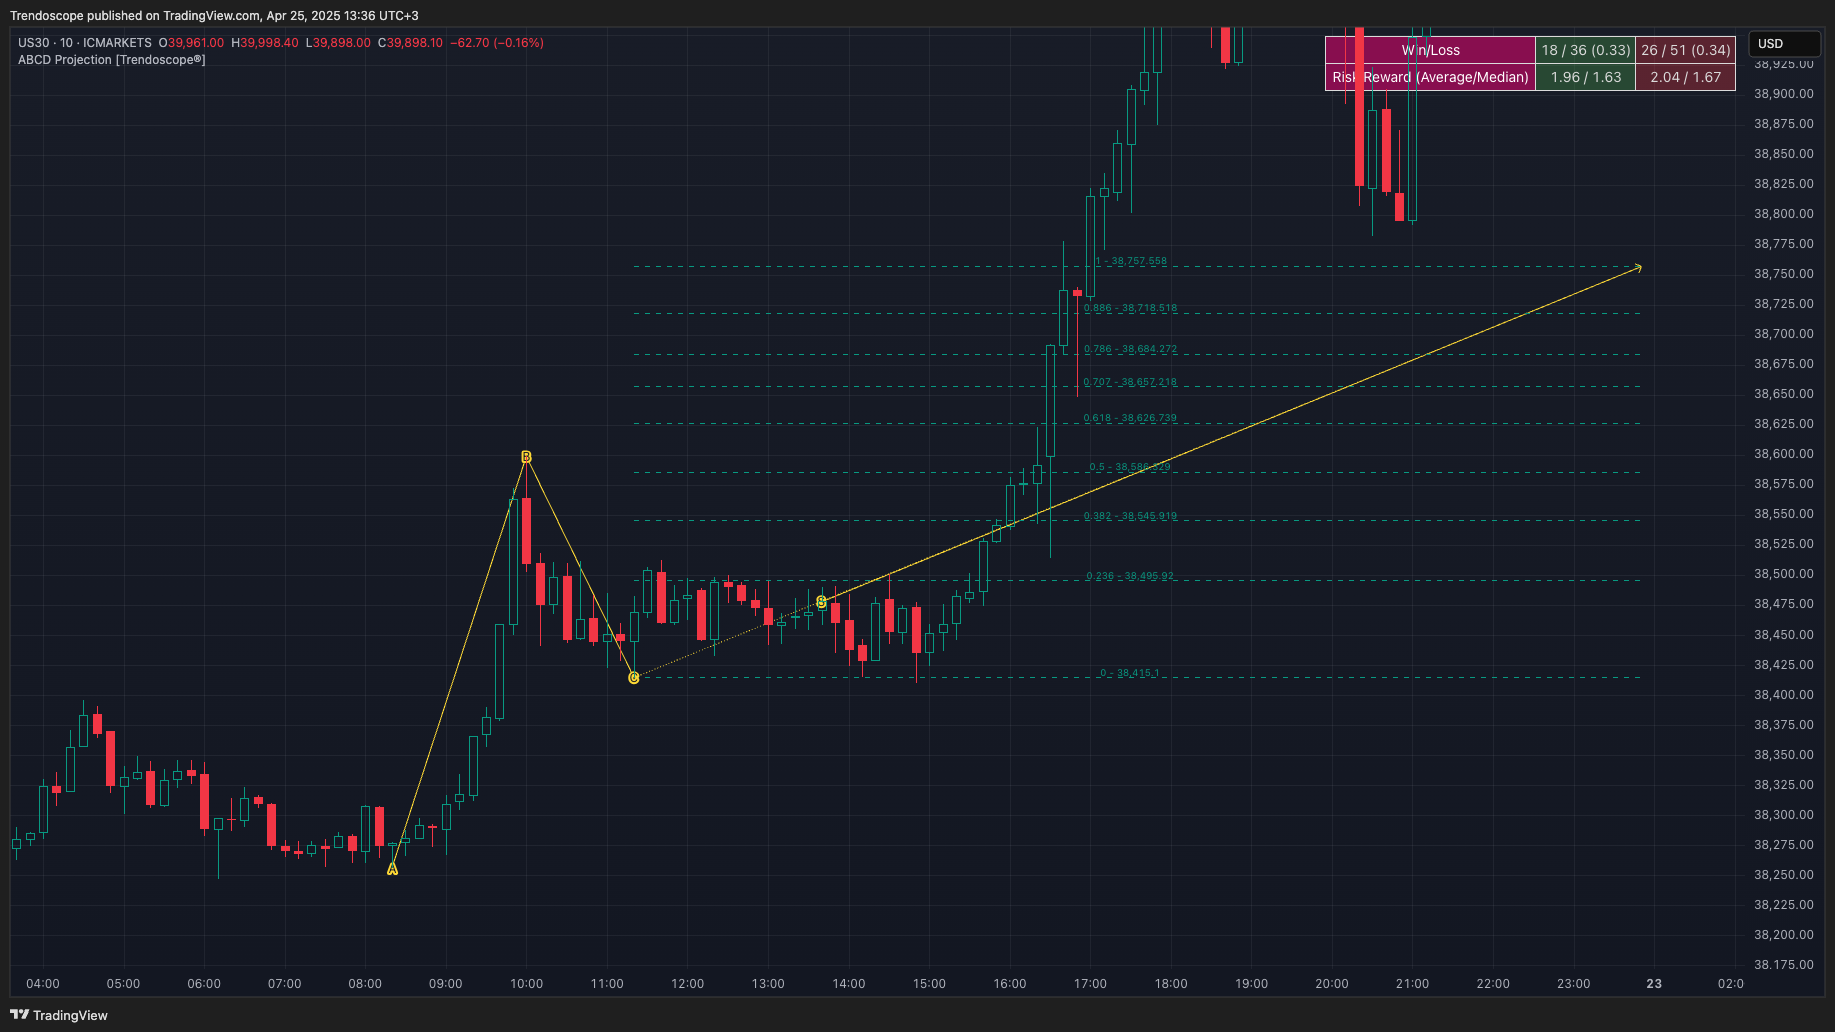
A, B, C Pivots and Zigzag Wave: These form the foundational structure of the ABCD pattern. The indicator uses a Zigzag algorithm to identify significant pivot points, ensuring accurate pattern detection.
S Point: This is the location where the pattern is identified, positioned a few bars away from the confirmed C pivot. It serves as the entry point for potential trades.
Estimated D Pivot: The D pivot is projected based on the price levels of A, B, and C. The time or distance to the D pivot is influenced by the S point, providing a target for the trade.
Mini Stats Table: Located in the top right corner of the chart, this table displays win/loss ratios and risk/reward data for both bullish and bearish scenarios, empowering traders with statistical insights.
Fibonacci Levels: Calculated from the C to D pivots, these levels offer additional reference points for analysis, enhancing the indicator’s versatility.
Why Focus on the ABCD Pattern?
The ABCD pattern is particularly effective in trending environments, where it excels at identifying opportunities after significant pullbacks. Unlike other chart patterns, the ABCD pattern is simple yet powerful, making it accessible to both novice and experienced traders. Its strength lies in its ability to project the D pivot, which serves as a potential price target, while also providing clear entry (S point) and stop-loss levels (based on pivot A).
The indicator enhances this by incorporating risk management principles. For instance, it filters patterns to ensure the retracement from the C pivot doesn’t exceed a defined threshold, preserving the trade’s potential. Additionally, the retracement ratio from the C pivot is a critical factor: a higher retracement ratio reduces the stop distance (from pivot A to S) while increasing the distance to the target (D), improving the reward/risk ratio.
How the Indicator Works
The ABCD Projection Indicator leverages a Zigzag-based algorithm to detect pivot points and construct the ABCD pattern. Here’s a step-by-step overview:
Pivot Identification: The indicator scans price data to identify significant highs and lows, forming the A, B, and C pivots.
Pattern Confirmation: Once the ABC pivots are confirmed, the indicator calculates the S point, marking the potential entry.
D Pivot Projection: Using the price swings from A, B, and C, the indicator projects the D pivot, providing a target price level.
Risk Management: The indicator evaluates the retracement ratio and ensures the pattern aligns with favorable risk/reward dynamics.
Visualization: The pattern is plotted on the chart, complete with Fibonacci levels and a stats table, giving traders a clear, actionable view.
Indicator Settings
We’ve kept the settings minimal and intuitive, with tooltips to guide users through configuration. Key customizable parameters include:
Zigzag Depth: Adjusts the sensitivity of pivot detection.
Retracement Threshold: Sets the maximum allowable retracement from the C pivot to filter high-quality patterns.
Risk/Reward Ratio: Allows traders to define their preferred risk/reward criteria for the stats table.
Fibonacci Levels: Enables customization of Fibonacci retracement levels for additional analysis.
These settings make the indicator adaptable to various trading styles and market conditions, whether you’re trading forex, stocks, or cryptocurrencies.
Why Choose the ABCD Projection Indicator?
1. Precision in Trending Markets
Since ABCD patterns thrive in trending environments, the indicator is optimized to filter out patterns in choppy or range-bound markets. This ensures traders focus on high-probability setups where the trend is likely to continue.
2. Enhanced Risk Management
By factoring in retracement ratios and stop distances, the indicator helps traders optimize their risk/reward profiles. The mini stats table provides real-time data on win/loss ratios, enabling data-driven decisions.
3. User-Friendly Design
Built with TradingView’s Pine Script, the indicator is easy to install and use. Its open-source nature allows traders to verify and even modify the code, aligning with TradingView’s community spirit.
4. Comprehensive Insights
Beyond pattern detection, the indicator offers Fibonacci levels and statistical data, giving traders a holistic view of each setup. This multi-layered approach supports informed decision-making.
Practical Applications
The ABCD Projection Indicator is versatile and can be applied across various markets and timeframes. Here are a few scenarios where it shines:
Day Trading: Use the indicator on lower timeframes (e.g., 15-minute or 1-hour charts) to capture intraday trends.
Swing Trading: Apply it to daily or 4-hour charts to identify multi-day trend continuations.
Forex and Crypto: The indicator’s ability to handle volatile markets makes it ideal for forex pairs and cryptocurrencies.
Stock Market: Use it to spot trends in individual stocks or indices during bullish or bearish phases.
For best results, combine the indicator with other tools like moving averages, RSI, or support/resistance levels to confirm the trend direction and strengthen your strategy.
Community and Support
In true TradingView spirit, the ABCD Projection Indicator is published as open-source, allowing traders to study and verify its functionality. We encourage you to favorite the script on TradingView for quick access and share your feedback with the community.
For those seeking additional features or premium indicators, visit www.trendoscope.io to explore our trial options or subscribe to our services. For detailed documentation, check out our knowledge base at docs.trendoscope.io
Final Thoughts
The ABCD Projection Indicator is more than just a tool—it’s a culmination of our passion for technical analysis and commitment to empowering traders. By automating the detection and projection of ABCD patterns, it simplifies the process of finding high-probability trades while prioritizing risk management and usability. Whether you’re a seasoned trader or just starting, this indicator offers a reliable way to navigate trending markets with confidence.
Ready to take your trading to the next level? Add the ABCD Projection Indicator to your TradingView chart today and start exploring its potential. Happy trading!
Disclaimer: The information provided by the ABCD Projection Indicator is not financial, investment, trading, or other types of advice or recommendations. Always conduct your own research and consult with a professional before making trading decisions.
Comments