Flag and Pennant Chart Patterns
After exploring Algorithmic Identification and Classification of Chart Patterns and developing Auto Chart Patterns Indicator, we now delve into extensions of these patterns, focusing on Flag and Pennant Chart Patterns. These patterns evolve from basic trend line pair-based structures, often influenced by preceding market impulses.
Link to the indicator: Flag and Pennant Chart Patterns
Identification rules for the Extension Patterns
Identify the existence of Base Chart Patterns
Before identifying the flag and pennant patterns, we first need to identify the existence of following base trend line pair based converging or parallel patterns.
- Ascending Channel
- Descending Channel
- Rising Wedge (Contracting)
- Falling Wedge (Contracting)
- Converging Triangle
- Descending Triangle (Contracting)
- Ascending Triangle (Contracting)
Identifying Extension Patterns.
The key to pinpointing these patterns lies in spotting a strong impulsive wave – akin to a flagpole – preceding a base pattern. This setup suggests potential for an extension pattern:
- A Bullish Flag emerges from a positive impulse followed by a descending channel or a falling wedge
- A Bearish Flag appears after a negative impulse leading to an ascending channel or a rising wedge.
- A Bullish Pennant is indicated by a positive thrust preceding a converging triangle or ascending triangle.
- A Bearish Pennant follows a negative impulse and a converging or descending triangle.
Pattern Classifications and Characteristics
Bullish Flag Pattern
Characteristics of Bullish Flag Pattern are as follows
- Starts with a positive impulse wave
- Immediately followed by either a short descending channel or a falling wedge
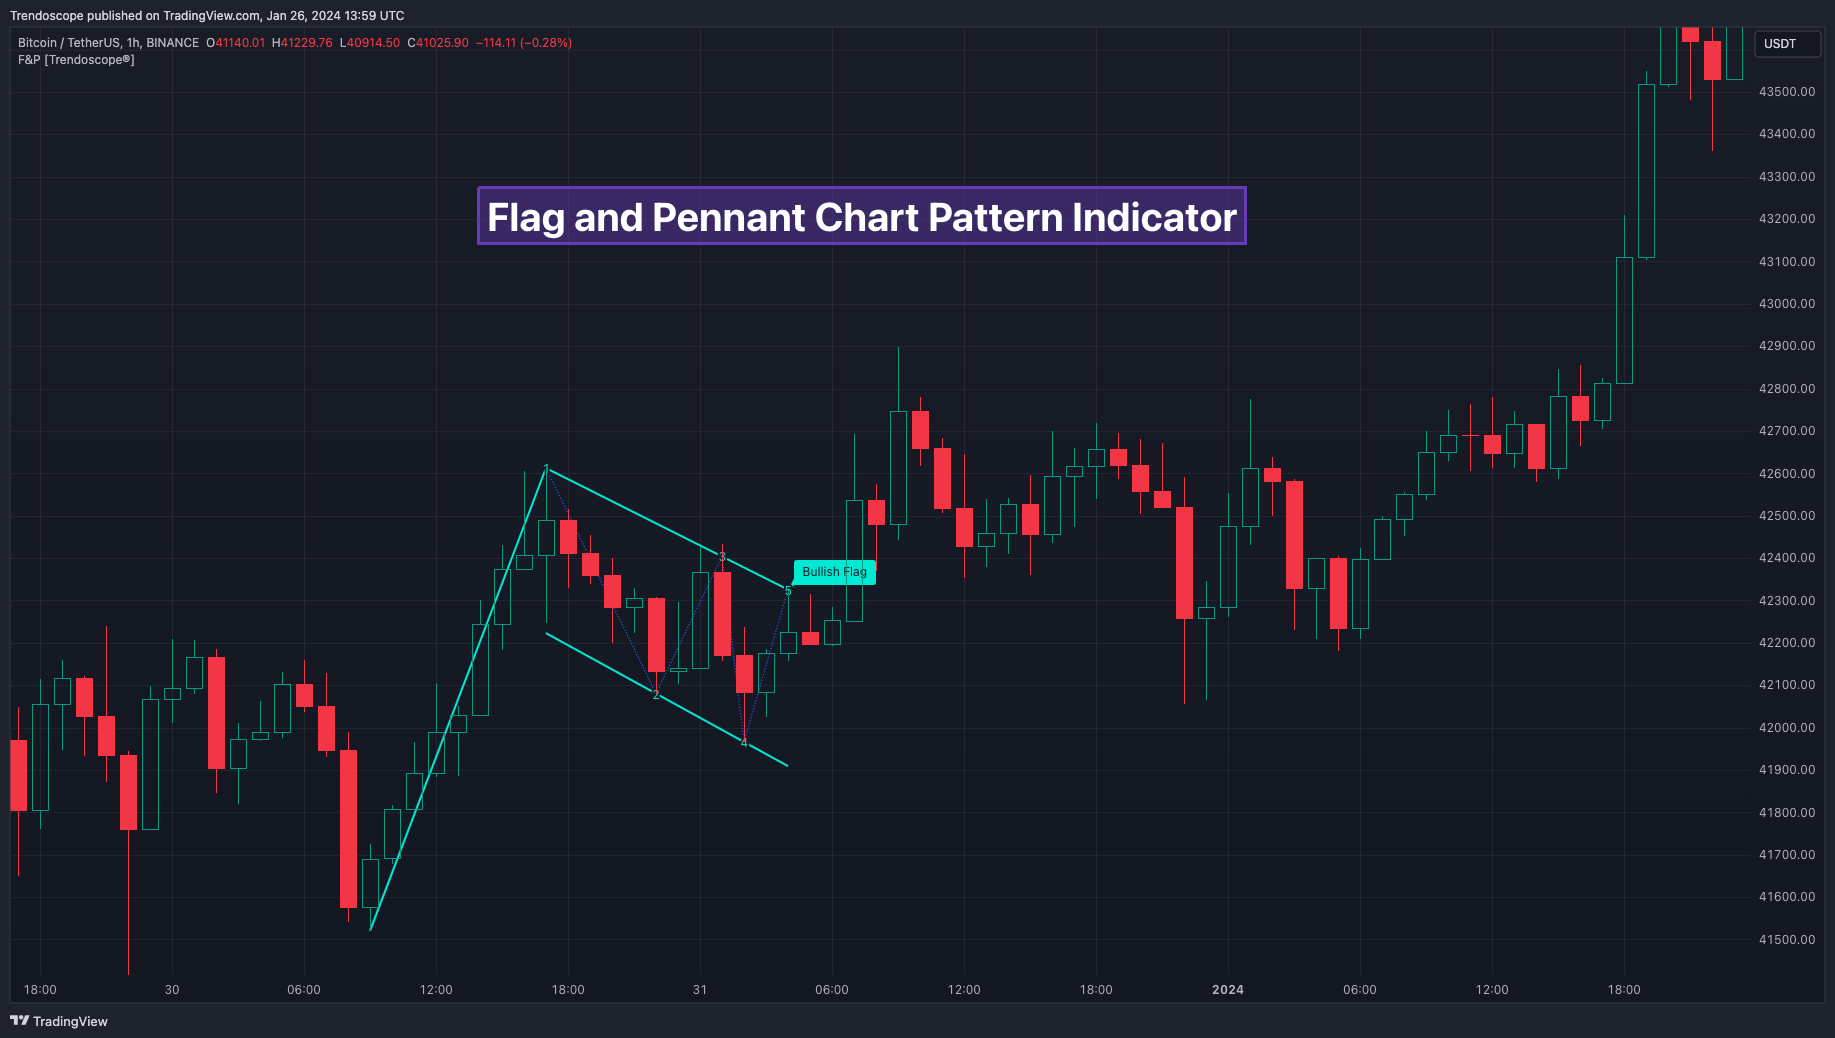
Here is an example of Bullish Flag Pattern
Bearish Flag Pattern
Characteristics of Bearish Flag Pattern are as follows
- Starts with a negative impulse wave
- Immediately followed by either a short ascending channel or a rising wedge
Here is an example of Bearish Flag Pattern
Bullish Pennant Pattern
Characteristics of Bullish Pennant Pattern are as follows
- Starts with a positive impulse wave
- Immediately followed by either a converging triangle or ascending triangle pattern.
Here is an example of Bullish Pennant Pattern
Bearish Pennant Pattern
Characteristics of Bearish Pennant Pattern are as follows
- Starts with a negative impulse wave
- Immediately followed by either a converging triangle or a descending converging triangle pattern.
Here is an example of Bearish Pennant Pattern
Trading Extension Patterns
In a strong market trend, it's common to see temporary periods of consolidation, forming patterns that either converge or range, often counter to the ongoing trend direction. Such pauses may lay the groundwork for the continuation of the trend post-breakout. The assumption that the trend will resume shapes the underlying bias of Flag and Pennant patterns
It's important, however, not to base decisions solely on past trends. Conducting personal back testing is crucial to ascertain the most effective entry and exit strategies for these patterns. Remember, the behavior of these patterns can vary significantly with the volatility of the asset and the specific timeframe being analyzed.
Approach the interpretation of these patterns with prudence, considering that market dynamics are subject to a wide array of influencing factors that might deviate from expected outcomes. For investors and traders, it's essential to engage in thorough back testing, establishing entry points, stop-loss orders, and target goals that align with your individual trading style and risk appetite. This step is key to assessing the viability of these patterns in line with your personal trading strategies and goals.
It's fairly common to witness a breakout followed by a swift price reversal after these patterns have formed. Additionally, there's room for innovation in trading by going against the bias if the breakout occurs in the opposite direction, specially when the trend before the formation of the pattern is in against the pattern bias.
Cheat Sheet
Indicator Settings
Custom Source : Enables users to set custom OHLC - this means, the indicator can also be applied on oscillators and other indicators having OHLC values.
Zigzag Settings : Allows users to enable different zigzag base and set length and depth for each zigzag.
Scanning Settings : Pattern scanning settings set some parameters that define the pattern recognition process.
Display Settings : Determine the display of indicators including colors, lines, labels etc.
Backtest Settings : Allows users to set a predetermined back test bars so that the indicator will not time out while trying to run for all available bars.
Comments