The Next Pivot Projection Indicator
Here is a very complex and detailed indicator that provides output in a simple and easy-to-understand way. The algorithm studies historical divergence outcomes and used them to project the next pivot. The script also won the Best Editor Picks of 2022 award
Link to the Indicator: Next Pivot Projection Indicator
Brief Description - Next Pivot Projection
Still experimental. Extending further on the divergence backtest results - in this script, we try to project the next 2 pivots (including one unconfirmed pivot)
Previous experiments
1. Divergence-Backtester
2. Divergence-Backtester-V2
Additions
- Apart from collecting the stats on the number of occurrences of HH, HL, LH, and LL - this script also keeps track of the average ratio for each level and average bars.
- Based on these data, we try to calculate the next pivot projections including possible bar and price.
- Cloud covering the candles indicate historical levels of average HH, HL, LH, and LL projections.
Hover over projection labels to find more details in the tooltips.
Method of Deriving Next Pivot Projection
An overall method in a nutshell
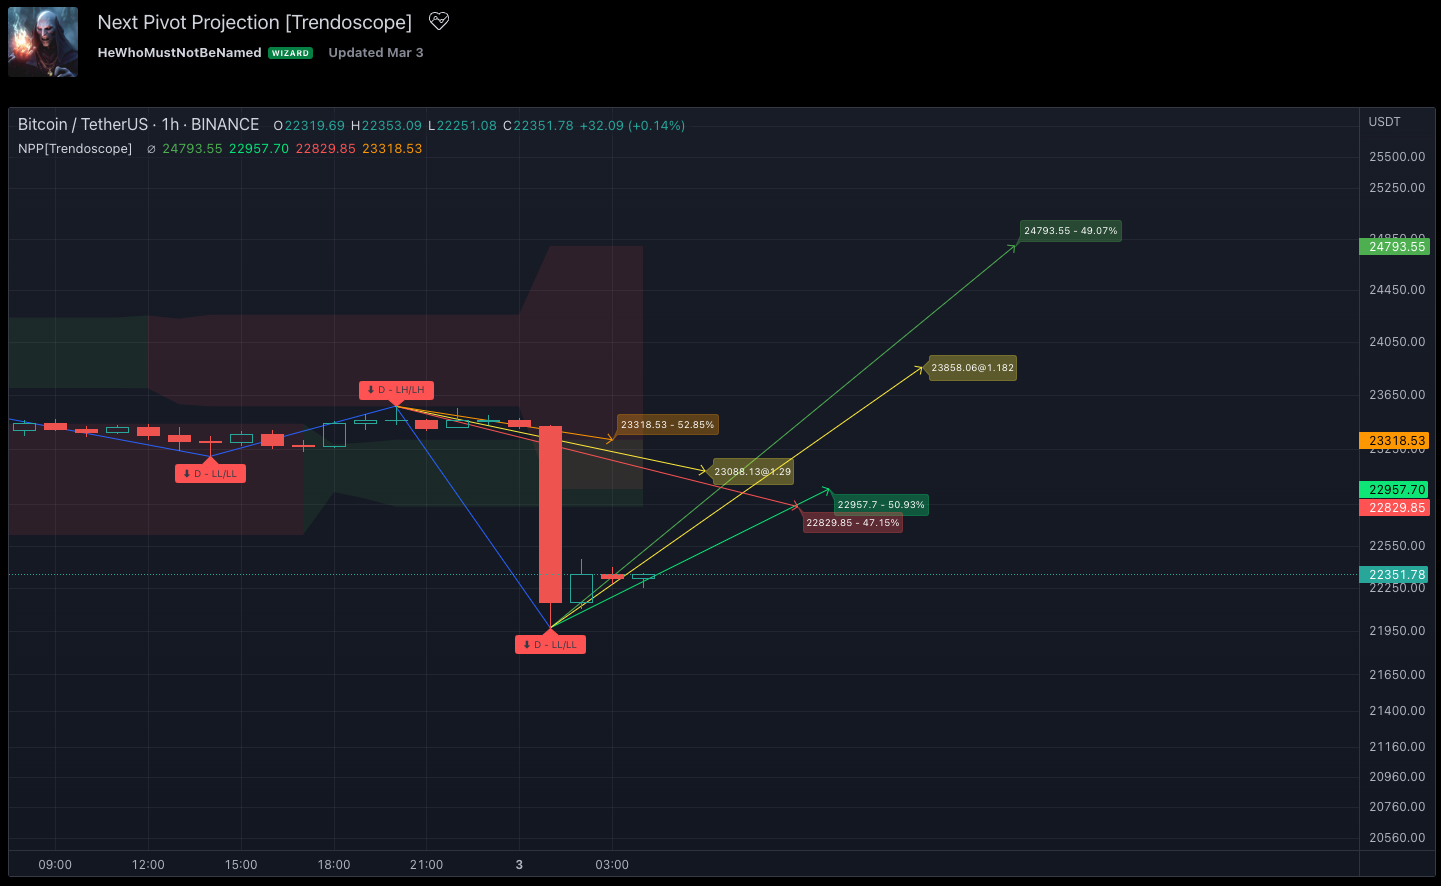
The picture below gives you an overall idea of how the indicator is defined and what it produces. Basically, the indicator keeps track of all the pivots and their status in terms of oscillator and divergence and uses that to project future pivots.
Going bit Deeper
Unconfirmed Pivot and its projection - Last pivot of the zigzag is always unconfirmed. Meaning, it can potentially repaint based on further price movements. But, the projection of the unconfirmed pivot will not change as it will be based on the previous two pivots - both of which are confirmed.
Next Pivot Projection - Next pivot is projected based on the last two pivots - which include the last unconfirmed pivot. Hence, these projections can potentially repaint based on the last pivot repaint.
Historical projections displayed as a cloud - Historical projection values are displayed as a cloud around pivots.
A cloud above represents an area from an average lower high range to an average higher high range. The cloud colour is green if the average ratio of pivot high is more than 1. Red Otherwise.
A cloud below represents the area from the average higher low range to the average lower low range. The cloud colour is red if the average ratio of pivot high is more than 1. Green otherwise
Settings
Indicator settings are pretty simple and allows users to select following things:
- Zigzag length on which the algorithm runs
- Oscillator type and length from a predetermined static list.
- History - How many bars to refer to for calculating the outcome
- Display properties to show pivots, labels and detailed stats.
Tabular information of historical occurrences can be viewed by selecting Detailed Stats.
Comments