Interactive Volume Profile

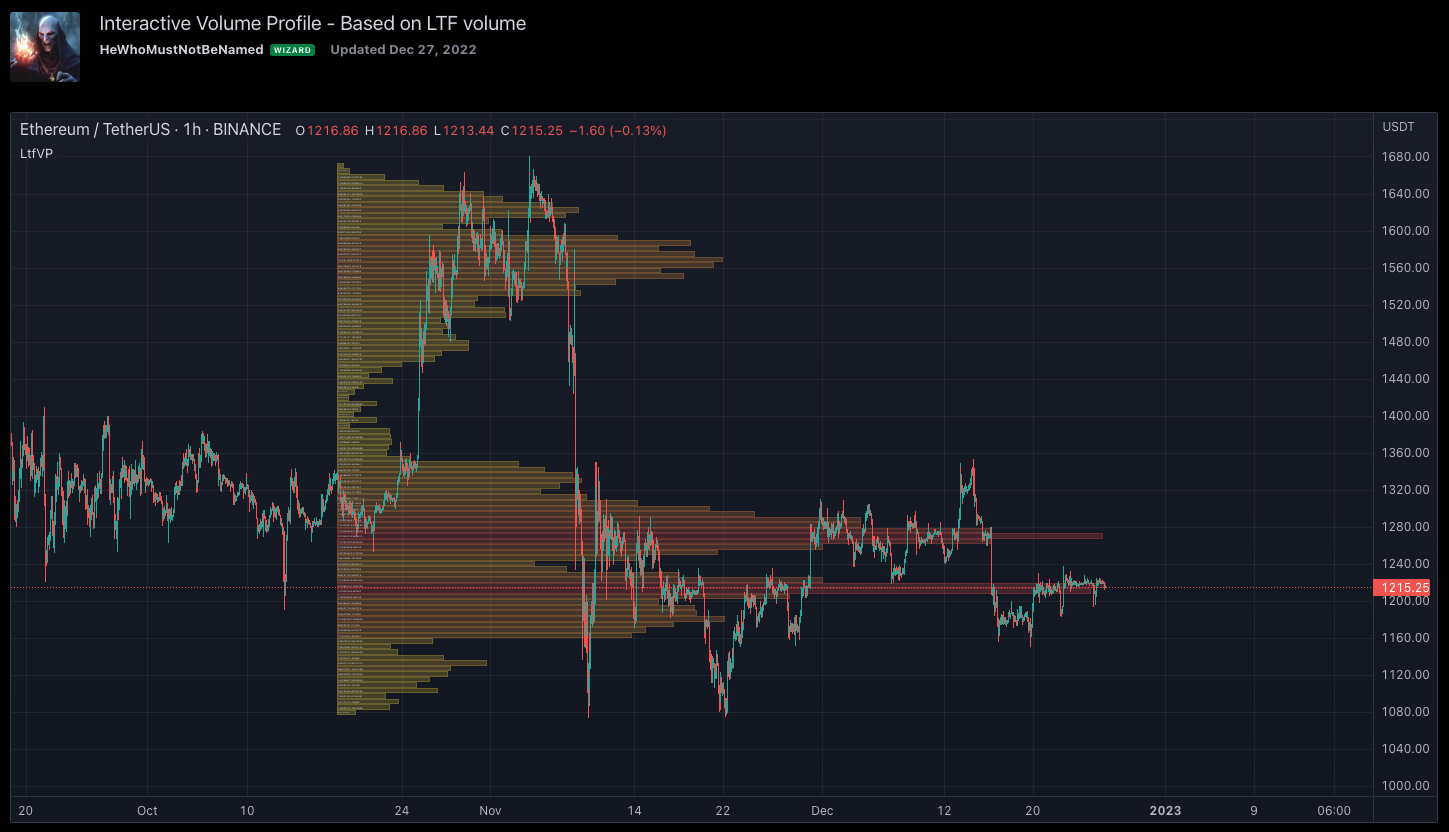
Here is a simple volume profile indicator built using Pinescript's security_lower_tf feature. The indicator makes use of intrabar price action to define better accuracy in defining volume profile ranges.
Link to the indicator: Interactive Volume Profile
Using Interactive Volume Profile Indicator
Upon loading the script, it will ask users to select the Time range to show the volume profile. Once you select the time range, confirmation input will pop up. Upon confirming the inputs, you will be able to view the volume profile
When the indicator is loaded, you will be able to see a line on starting and ending range. And upon zooming into the volume profile bars, you can see the actual volume printed on the bars at each level.
Settings - Interactive Volume Profile
Settings are pretty simple. Some of them appear as part of confirmation.
- Lower Timeframe: Lower timeframe which is used for more granular calculation of the volume profile. The lower the value more accurate the calculation of the volume profile will be. But, it also means that the indicator will only be able to cover a lesser number of bars due to the pinescript's limitation of availability of lower timeframe bars.
- Apply for Max Available Bars: If selected the indicator will ignore the start and end time and draw the volume profile for maximum available data which ends with the last bar.
- Volume Source: Users can select either absolute volume or traded volume.
- Start and End range: These parameters are selected upon confirmation pop-up and also vary based on interactive input changes done via drag and drop.
- Number of Levels: This is the number of volume bars to display.
- Transparency: Color transparency to fill the bars.
- Border: When selected shows the border between each volume profile bars
- Display Volume: Displays the actual volume on the bars. Can be seen when we zoom in.
- Percentile: Instead of using the percentage values, use percentile to define the length of the bars.
Limitations due to the availability of LTF bars
security_lower_tf can only fetch up to 100k bars, Hence, if we move the starting point beyond that, we will only see the volume profile from the bar where LTF volume data is available. Increasing lower timeframe resolution will also increase the available range of volume profile. An option is also available to use the max range instead of the time-based range. If the max bar range is selected, then the volume profile is drawn based on all the bars for which LTF volume is available.
An example of all combinations is shown below.
The number of levels can be set from settings that impact the granularity of the volume profile. Below is an example of how different values for the number of levels behave.

Comments