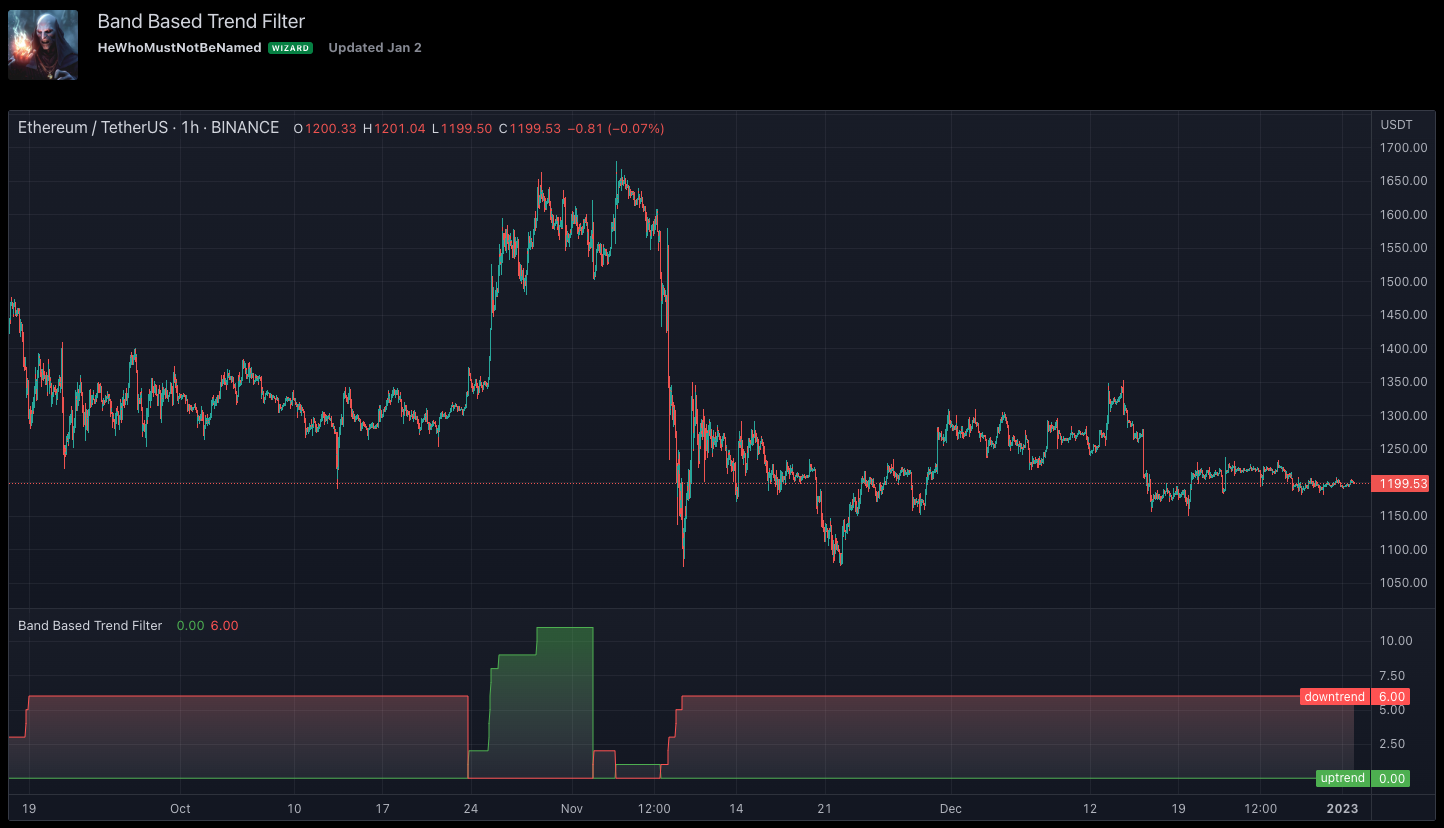
Band-Based Trend Filter

This technical indicator defines a trend based on popular band indicators. Instead of a reversal mindset, the indicator looks to identify breakouts as the trend
Link to the indicator: Band-Based Trend Filter
Defining Trend based on Breakout
Contrary to the reversal mindset, we define trends when the price hits either side of the band. If the close price hits the upper band then it is considered bullish and if the close price hits the lower band, then it is considered bearish. Further, trend strength is measured in terms of how many times the price hits one side of the band without hitting the other side. Hit is counted only if the price has touched the middle line in between the touches. This way price walks on the bands are considered as just one hit.
Band breakout indicators, such as Bollinger Bands, Keltner Channels, and Donchian Channels, are based on the idea that price tends to oscillate between upper and lower bounds and that breakouts from these bounds can indicate the start of a trend. The basic idea is that when the price breaks out above the upper band, it signals a bullish trend, and when the price breaks down below the lower band, it signals a bearish trend.
Let's take Bollinger Bands as an example. Bollinger Bands are calculated using a moving average and a standard deviation. The upper band is set at a distance of 2 standard deviations above the moving average, and the lower band is set at a distance of 2 standard deviations below the moving average. When the price moves outside of these bands, it is considered a breakout.
In a trend-following system, you would use these band breakout indicators to identify the start of a new trend. For example, if the price breaks out above the upper Bollinger Band, it could be a signal to enter a long position, since it suggests that the price is starting a new bullish trend. Conversely, if the price breaks down below the lower Bollinger Band, it could be a signal to enter a short position, since it suggests that the price is starting a new bearish trend.
It's important to note that band breakout indicators are not foolproof, and false breakouts can occur. For example, the price can briefly move outside of the upper or lower band, only to quickly move back inside the bands. This can result in false signals and losses if you enter a position based on the breakout.
Settings of Band-Based Trend Filter
Settings are minimal and details can be found in the tooltips against each parameter

Comments