RSI - Dynamic Levels
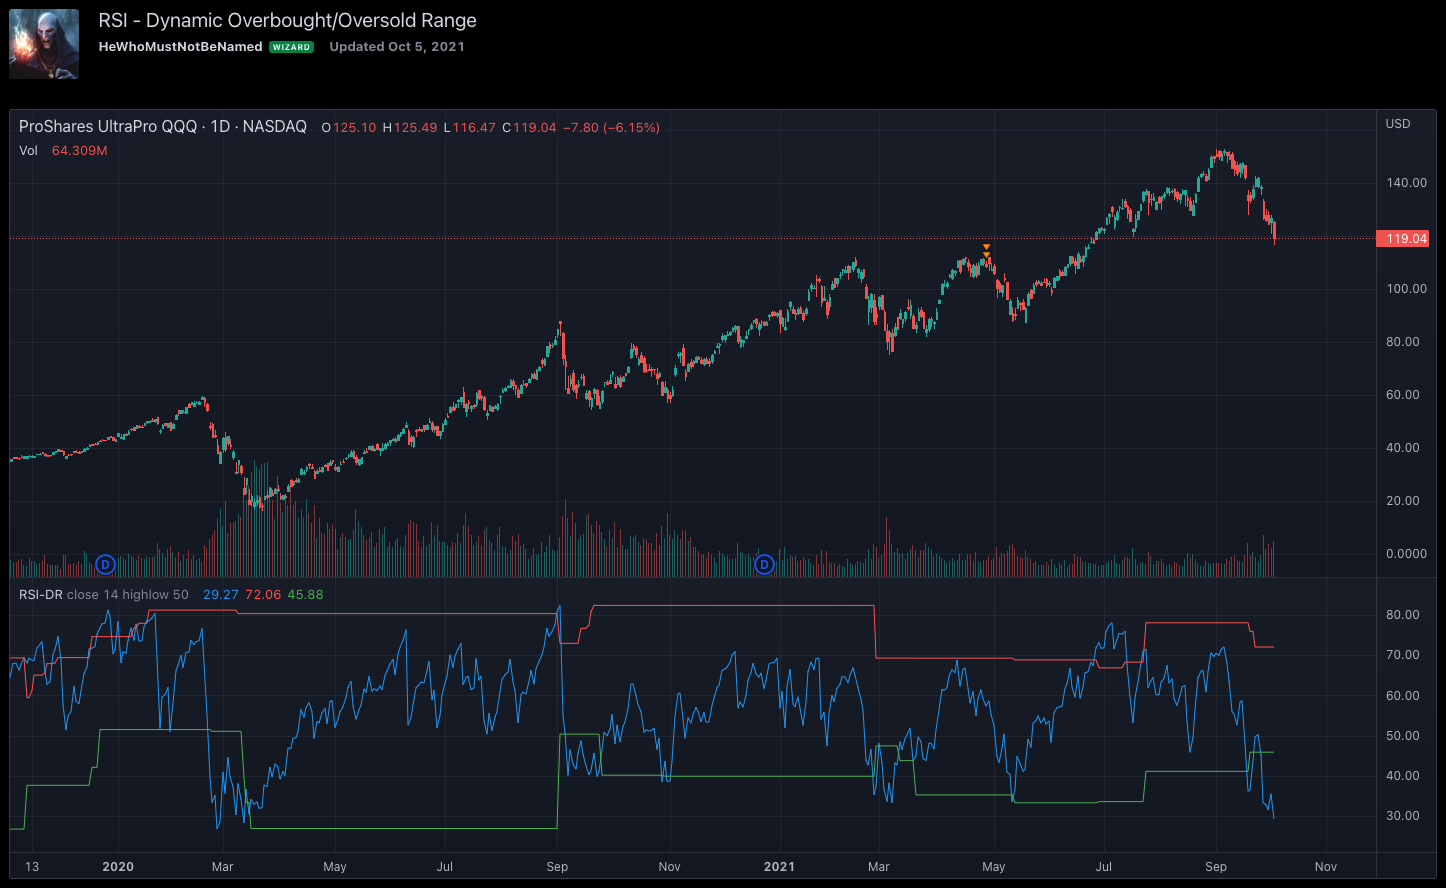
This technical indicator is a simple yet very effective tool for the interpretation of the RSI - Relative Strength Index. Based on past RSI values the indicator generates dynamic overbought and oversold levels which is advantageous over the static 70/30 or 80/20 range.
Link to the Indicator: RSI Dynamic Levels
Explanation - RSI Dynamic Levels
Default overbought/oversold levels of RSI do not hold well for instruments that are trending well. It happens often that instruments keep trading in a single half of the range for a prolonged time without even touching the other half. This also came up often in tradingview pine chat discussions where I participate regularly.
Hence, thought of creating this script to help other scriptors in finding different methods to derive dynamic high/low range of RSI. This can also be adapted for other range-bound oscillators - though not included in this script.
The method involves a few simple steps
- Derive multi-timeframe RSI. Parameters - Resolution, Source and Length are pretty straightforward. Repaint when unchecked uses the previous bar value.
- Dynamic range detection follows the below steps.
- Get the highest and lowest of the oscillator source for the Range Length period.
- Use the Detection method further to refine the highest and lowest range. If the detection method is "highlow", then it looks for the lowest value for the high range and the highest value for the low range. If not, uses the moving average
Note: Detection range length is used only for finding the highest and lowest Oscillator value ranges. Further detection range methods of highlow and other moving average types use Oscillator length.
Comments