Innovative Zigzag Indicators
Here are some of the innovative technical indicators built on the Zigzag indicator combined with classical technical analysis and modern concepts.
The Zigzag Cloud Indicator
Link to the indicator: Zigzag Cloud Indicator
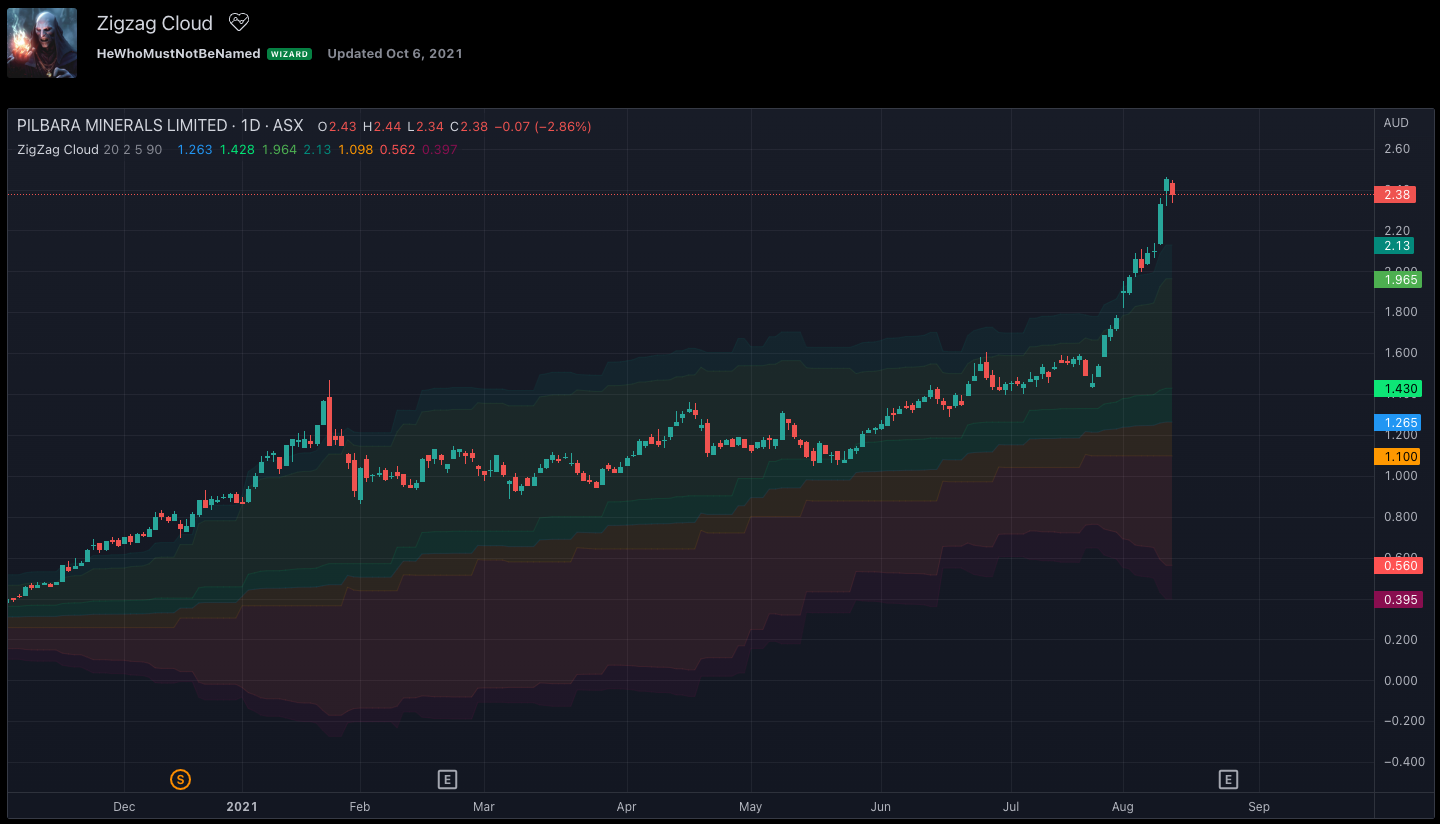
This is Bollinger Band built on top of Zigzags instead of regular price + something more. The indicator presents 7 lines and clouds around it. This can be used to visualize how low or high the price is with respect to its past movement.
- Middle line is the moving average of the last N zigzag pivots
- Lines adjacent to the moving average are also moving averages. But, they are made of only pivot highs and pivot lows. This means the line above the moving average is the pivot high moving average and the line below the moving average is the pivot low moving average.
- Lines, after pivot high/low moving averages, are upper and lower Bollinger bands based on Moving Average Line with 2 standard deviation difference.
- Outermost lines are the Bollinger band top of the Moving average pivot high and the Bollinger band bottom of the moving average pivot low.
Zigzag Candles Indicator
Link to the indicator: Zigzag Candles
Can't deny that we are obsessed with zigzags. Been doing some crazy experiments with it and have many more in the pipeline. I believe zigzag can be used to derive better trend-following methods. Here is an attempt to visualize zigzags as candlesticks. Next steps are probably to derive the moving average, atr (although there was an attempt of AZR made earlier) and probably supertrend too ;)
Input parameters include ZigzagLength (to calculate zigzag) and CandleSize (number of zigzag pivots in each candle)
CandleSize can be 3 or more. Every time we collect pivots that are equal to CandleSize, we derive one candle. And when we derive a candle, we remove all old pivots except the last one. Because the last pivot acts as an open to the next bar and is required.
The body of the candle tells the start and end zigzag pivot in the range. And Wicks signify the highest and lowest pivots in the range. High and Low wicks are placed at the pivot where high and lows are formed. Hence, you can see them at different positions each time.
Zigzag Candles Moving Average
Link to the indicator: Zigzag Candles Moving Average
Let's create a moving average!!
Just a simple moving average at the moment. Since items are in the array. Not so easy to use standard functions of pine. Hence, will take that for future enhancements.
Updated with a few moving average options:
- sma
- ema
- wma
- zelma
- hma
Moved to a different overlay and added candles back for reference.
Average Zigzag Range Indicator
Link to the indicator: Average Zigzag Range
Here is an attempt to calculate Average Zigzag Range (AZR). This can be used similarly to ATR. Using AZR instead of ATR for trailing stop calculation may yield better outcomes in trend trading.
The logic is simple.
- Calculate zigzag based on ZigzagLength
- Calculate the distance between each zigzag pivot
- Calculate the simple moving average of the last MALength pivots
- Use the DoubleMA option to further smooth AZR using a Secondary Moving Average
Zigzag Candles Supertrend
Link to the indicator: Zigzag Candles Supertrend
Zigzag candles supertrend is another innovative indicator built on Zigzag and classical technical analysis indicator Supertrend. Here we apply supertrend based on Zigzag candles and Average Zigzag Range.
Zigzag candle parameters Length and CandleSize remain as is. Along with this, we also add MALength and AtrMult to calculate ATR based on the new candles and to use it to derive supertrend.
Comments