Historical Pattern Matcher
Are you a firm believer in the predictability of historical patterns guiding market trends? If so, this indicator is tailor-made for you.
Link to the Indicator: Historical Pattern Matcher Indicator
The Concept of Historical Pattern Matching
The beauty of this script lies in its adaptability to any recurring pattern, irrespective of its recognition or label. The indicator diligently accumulates crucial data over a defined timeframe:
- It compiles all conceivable patterns within a set number of pivotal points, centered around the price relationships of each pivot. (Default: 6)
- Tracks every potential pattern across the provided pivotal points, tallying the frequency of each pattern's appearance.
- Records the subsequent pivot's movement (measured by retracement ratio) after the pattern emerges, for every instance.
- Keeps tabs on the most recent occurrence of each pattern amassed.
On-Chart Display
Witness the power of information on your chart through the following insights:
- Current Pattern illustration, driven by the latest verified pivot.
- Current Pattern depiction, derived from the current unconfirmed pivot in the opposing direction.
- Projected range based on historical retracement ratios for both patterns.
- In-depth insights into the last occurrence and the cumulative instances.
- Last occurrences of both validated and unconfirmed pivot patterns.
It's important to note that if a pattern doesn't repeat within the designated timeframe, it won't be displayed on the screen. This is entirely normal if the current pattern hasn't yet recurred in the past.
Details of Using Historical Pattern Matcher Indicator
When you load the indicator onto your chart, you'll have the opportunity to observe the subsequent patterns and projections.
Following information are displayed on the chart for both confirmed and last unconfirmed pivots.
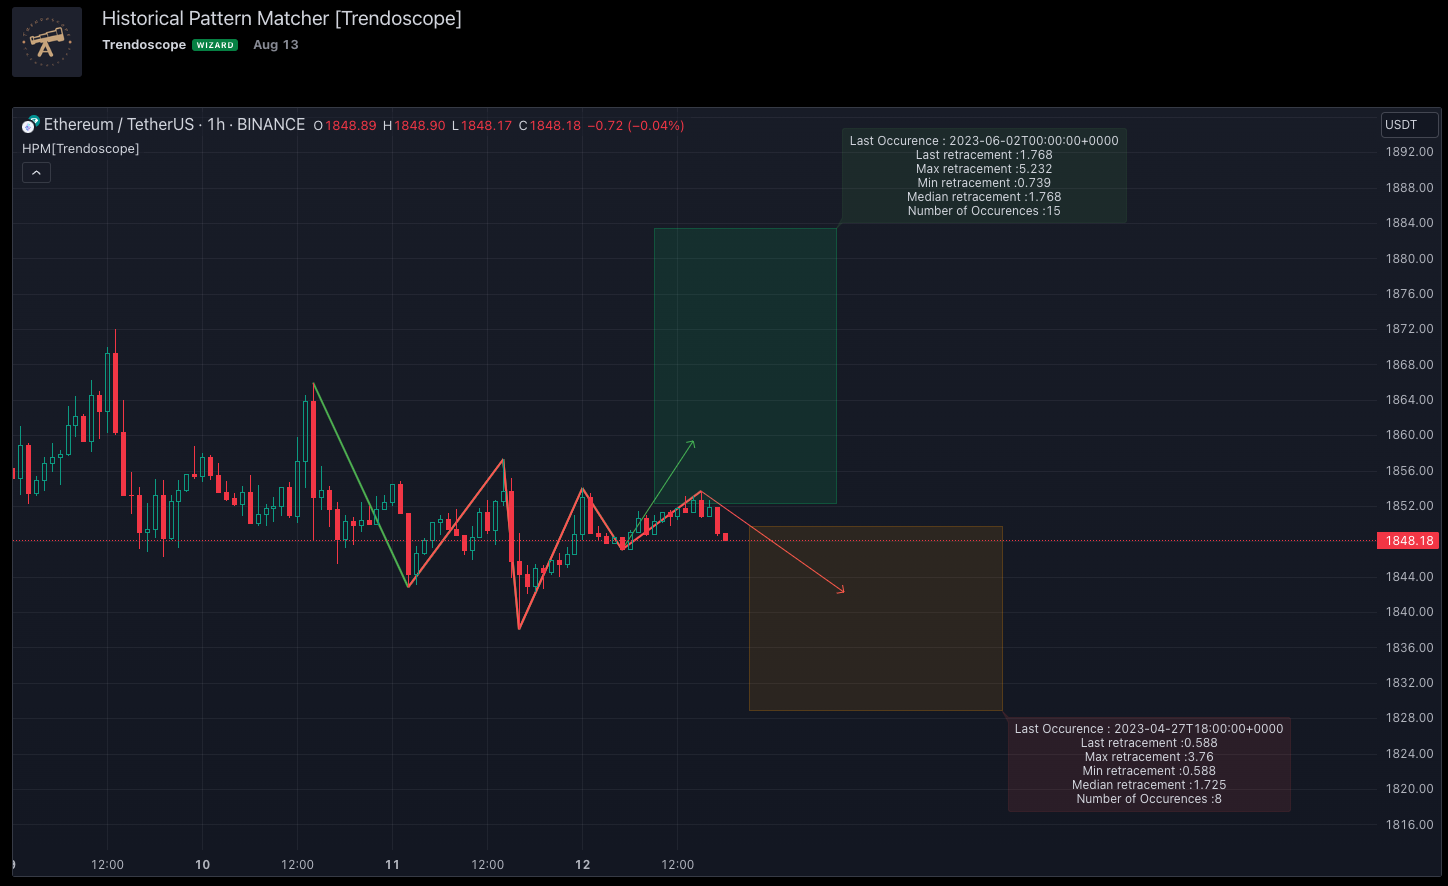
- Zigzag for pattern ending with last confirmed/unconfirmed pivot and the projection for next pivot. The colour of this pattern will be based on the direction of the next pivot projection. If the next pivot projection is bullish, then the pattern will be coloured green else it will be red. The colours for bullish and bearish patterns can be adjusted in the settings. Since last confirmed and unconfirmed pivots will generally be in opposite direction, one of them will be green and the other will be red. Also note that both patterns overlap due to sharing common zigzag lines. Overlapping zigzag lines will have the colour of unconfirmed pivot pattern.
- Box representing projection range. This is again coloured based on direction of projection. The projection box defines following.
- Minimum and maximum retracement based on historical outcome. Farther end of the box represents the maximum retracement ratio observed historically whereas the nearest end of the box represents the minimum retracement ratio observed on historical timelines.
- Projection line representing the median retracement ratio based on historical values. Projection lines are coloured based on direction of the projection.
- Label containing details such as
- Last Occurrence of the pattern
- Max and min retracements observed.
- Median retracement value
- Number of occurrences of the pattern.
As you delve into the pattern specifics, you'll find insights about the pattern's latest occurrence. By scrolling leftward on your chart to the indicated date and time, you can gain insights into the pattern's past formation and the ensuing price movement.
For instance, the most recent confirmed pivot-based pattern occurrence took place on 02-Jun-2023 at 00:00 UTC.
And last occurrence of pattern based on unconfirmed pivot happened on 27-Apr-2023 22:00 UTC time
Input Settings for Historical Pattern Matcher indicator
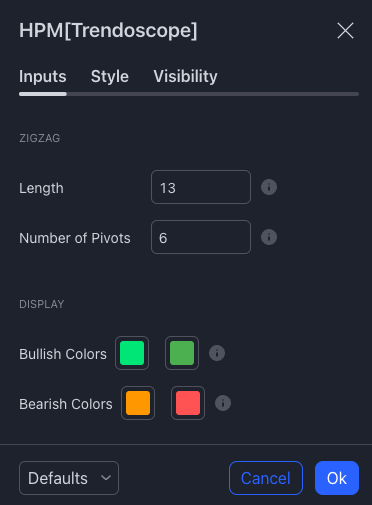
Settings are minimal, and here is the meaning of them.
- Zigzag Length - As we all know, Zigzag are basic building blocks for any pattern recognition algorithm. Here too we are using zigzag as base for detecting price patterns. Zigzag length parameter can be adjusted according to user's preference.
- Number of Pivots - How many pivots to be considered to form pattern? Generally Harmonic Patterns are formed from 5 pivots, Chart patterns can be 4-7 pivots. You can find your own pattern by increasing the number of pivots in the settings. Chosing optimal number of pivots is important as having too high or too low numbers can result in following issues.
- Lower number of pivots may show insignificant outcome as the price pattern may not conclusive enough to identify the repetitiveness
- Higher number of pivots may lead to less repetitive patterns and hence again may not give reliable data.
Considerations while using Historical Pattern Matcher Indicator
The indicator is defined to capture historical stats and present them on the screen. Users can then apply the due diligence to interpret these data. Price does not need to fall in place for all the projections. The projections can be extended or new patterns can be formed over period of time. However, following points can be considered for identifying consistency of the patterns.
- Number of Occurences: This needs to be relatively higher. Lower values means pattern has not repeated many times to consider for any analysis.
- Distance between Median retracement and min/max retracements: This is crucial information as one big retracement or small retracement may skey the overall data. If median value is close to max retracements, it means historically retracement is been more towards the higher side and expect a higher price movement. Similarly if the median value is closer to minimum retracement, then we can deduce that the max ratios are skewed by few occurences.
- Distance between last Occurrence ratio and median: This can be a confirming factor on how well the patterns are falling in place historically.
- Last occurence time: If the last occurence happened relatively not long ago, then we can consider that the pattern is more reliable than something that has not happened for long time. This needs to be used in conjunction with other parameters.
- Opposite projection: Unconfirmed and confirmed pivot projections will always be on opposite sides. Looking at the projection on the opposite side can sometime reinforce our confidence in the current pattern. Or it can tell the alternate possibilities.
Comments