Harmonic Pattern Based Trend Follower
One of the innovative concepts that combine trend following and reversals. This indicator tries to define trends based on harmonic pattern price action.
Link to the Indicator: Harmonic Pattern based Trend Follower
Concept of Harmonic Pattern and Trend Following
Harmonic Pattern as the system is known for finding possible reversal zones and hence assists in swing trading. But, the most effective way of using harmonic patterns is in trend following. This can yield really amazing results when played with proper risk management.
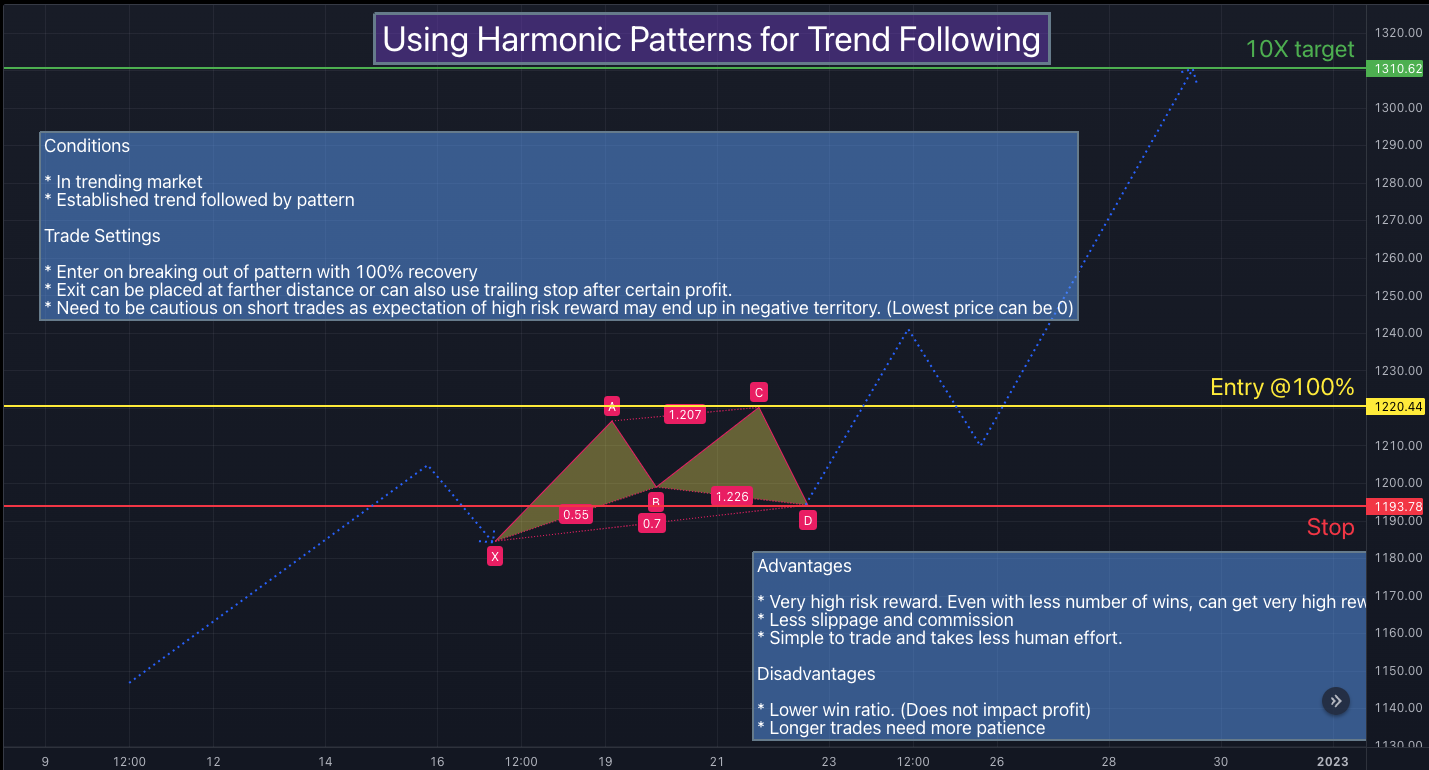
Conditions
- In a trending market
- Established trend followed by pattern
Trade Settings
- Enter on breaking out of pattern with 100% recovery
- Exit can be placed at a farther distance or can also use a trailing stop after a certain profit.
- Need to be cautious on short trades as expectation of high risk-reward may end up in the negative territory. (Lowest price can be 0)
Advantages
- Very high risk-reward. Even with less number of wins, can get a very high reward.
- Less slippage and commission
- Simple to trade and takes less human effort.
Disadvantages
- Lower win ratio. (Does not impact profit)
- Longer trades need more patience
Here is a link to the original article published in the Tradingview platform - "Using Harmonic Pattern with Trend Following System"
About Harmonic Pattern Based Trend Follower Indicator
Process - How to derive the Harmonic Pattern Trend?
- Derive Zigzag and scan harmonic patterns for the last 5 confirmed pivots
- If a pattern is found, the highest point of the pattern will become the bullish zone and the lower point of the pattern will become the bearish zone.
- Since it is the trend-following method when the price reaches the bullish zone, then the trend is considered bullish and when the price reaches the bearish zone, the trend is considered bearish.
- If the price does not touch both regions, then the trend remains unchanged.
- Bullish and bearish zone will change as and when new patterns are formed.
Note: Patterns are not created on the latest pivot as the last pivot will be unconfirmed and moving. Due to this, patterns appear after a certain delay - patterns will not be real-time. But, this is expected and does not impact the overall process.
Here are some of the screenshots which display the behaviour of the Harmonic Pattern Based Trend Follower Indicator
When a new pattern is formed
When price breaks over the zones
Output - What outcome to be expected?
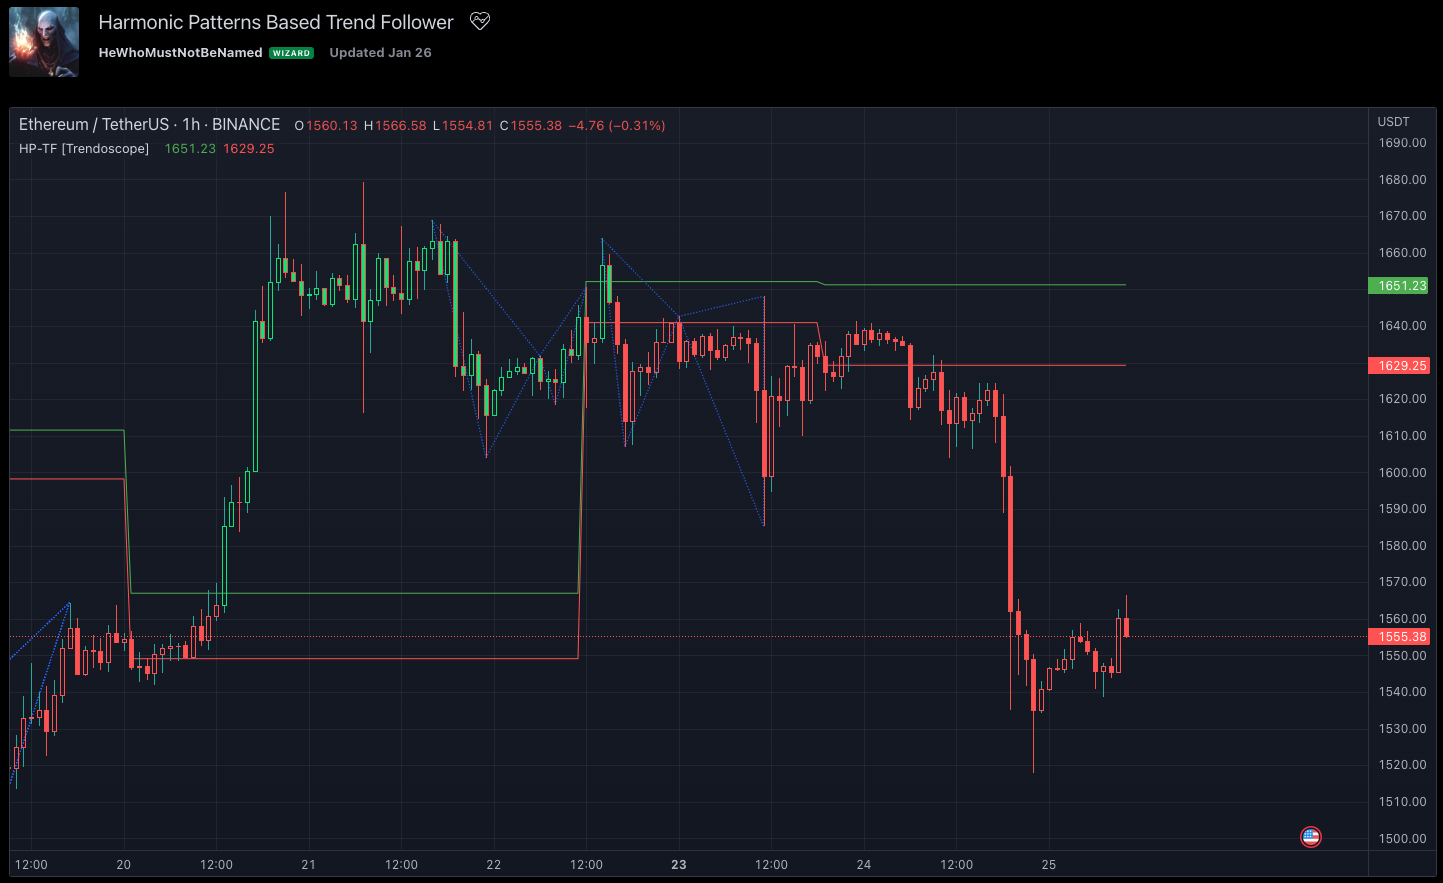
- Patterns formed are drawn in blue-coloured lines. Due to the pine limitation of max 500 lines, older patterns automatically get deleted when new ones come.
- Bullish Zone and Bearish Zone are plotted in green and red colours and the zone will change whenever a new pattern comes along.
- Bar colours are changed according to the calculated trend. Trend value can be 1 or -1 based on the current trend. You can also find the value in the data window.
- For simplicity purposes, input options for the selection of specific patterns are not provided and also pattern names are not displayed on the chart.
Settings - What are the configurable parameters?
Settings are pretty simple and straightforward. There are parameters to define Zigzag and Harmonic Pattern error threshold. And there are parameters to calculate entry and exit-based trends. All the details are incorporated as tooltips and can be found easily on the Indicator settings.
Comments