Extreme Trend Reversal Points
Extreme Trend Reversal Points based on Recursive Moving Averages is an indicator designed to estimate reversal points based on how well the instrument has trended. The highlight of this indicator is that the calculations of moving averages are done in a recursive manner.
Link to the indicator: Extreme Trend Reversal Points
Concept of Recursive moving average
Using moving average crossover for identifying the change in trend is very common. However, this method can give lots of false signals during the ranging markets. In this algorithm, we try to find the extreme trend by looking at fully aligned multi-level moving averages and only look at moving average crossover when the market is in the extreme trend - either bullish or bearish. These points can mean a long-term downtrend or can also cause a small pullback before trend continuation. In this discussion, we will also check how to handle different scenarios.
Recursive Multi Level Moving Averages
Multi-level moving average here refers to applying the moving average on top of the base moving average on multiple levels. For example,
Level 1 SMA = SMA(source, length)Level 2 SMA = SMA(Level 1 SMA, length)Level 3 SMA = SMA(Level 2 SMA, length)......Level n SMA = SMA(Level (n-1) SMA, length)
In this script, the user can select how many levels of moving averages need to be calculated. This is achieved through the "recursive moving average" algorithm.
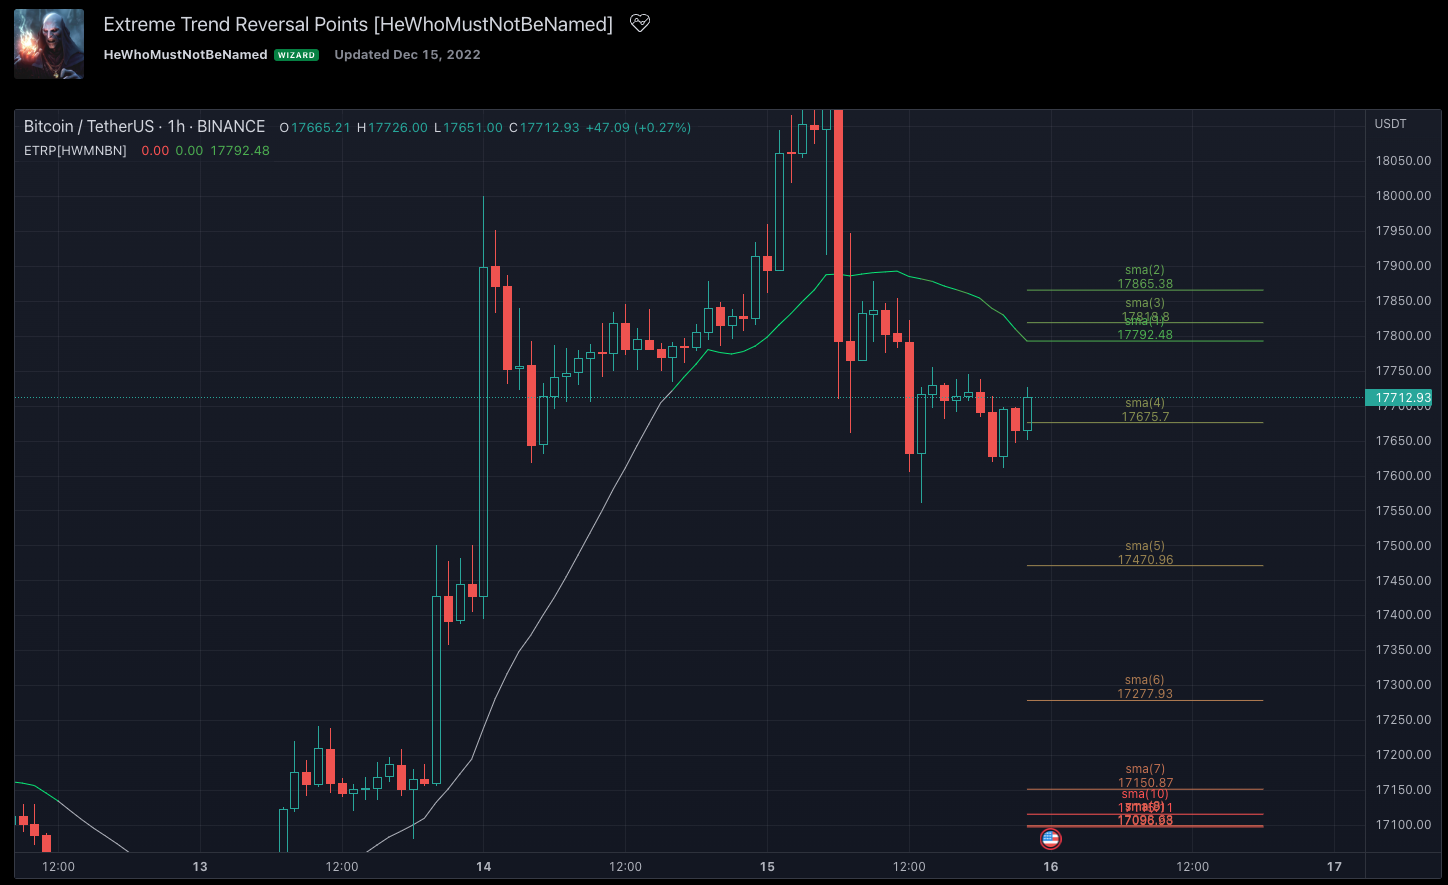
Note that since we are using variable levels - we will not be able to plot all the levels of the moving average. (This is because plotting cannot be done in the loop). Hence, we are using lines to display the latest moving average levels in front of the last candle. Lines are colour-coded in such a way that least numbered levels are greener and higher levels are redder.
Finding the trend and range
The strength of a fully aligned moving average is calculated based on the position of each level with respect to other levels.
For example, in a complete uptrend, we can find
source > L(1)MA > L(2)MA > L(3)MA ...... > L(n-1)MA > L(n)MA
Similarly, in a complete downtrend, we can find
source < L(1)MA < L(2)MA < L(3)MA ...... < L(n-1)MA < L(n)MA
Hence, the strength of the trend here is calculated based on the relative positions of each level. Due to this, the value of strength can range from 0 to Level*(Level-1)/2
0 represents the complete downtrend
Level*(Level-1)/2 represents the complete uptrend.
Range and Extreme Range are calculated based on the percentile from the median. The brackets are defined as per input parameters - Range Percentile and Extreme Range Percentile by using Percentile History as reference length.
The moving average plot is colour coded to display the trend strength.
Green - Extreme Bullish
Lime - Bullish
Silver - Range
Orange - Bearish
Red - Extreme Bearish
Finding the trend reversal
Possible trend reversals are when the price crosses the moving average while in a complete trend with all the moving averages fully aligned. Triangle marks are placed in such locations which can help observe the probable trend reversal points. But, there are possibilities of trends overriding these levels. An example of such a thing, we can see here:
In order to overcome this problem, we can employ a few techniques.
- After the signal, wait for trend reversal (moving average plot colour to turn silver) before placing your order.
- Place stop orders on immediate pivot levels or support resistance points instead of opening market orders. This way, we can also place an order in the direction of the trend. Whichever side the price breaks out, will be the direction to trade.
- Look for other confirmations such as extremely bullish and bearish candles before placing the orders.
An example of using stop orders
Let us take this scenario where there is a signal on the possible reversal from a complete uptrend.
Create a box joining high and low pivots at a reasonable distance. You can also choose to add 1 ATR additional distance from pivots.
Use the top of the box as stop-entry for long and the bottom as stop-entry for short. The other ends of the box can become stop-losses for each side.
After a few bars, we can see that a few more signals are plotted but, the price is still within the box. There are some candles that touched the top of the box. But, the candlestick patterns did not represent bullishness in those instances. If you have placed stop orders, these orders would have already been filled in. In that case, just wait for the position to hit either stop or target.
For the bullish side, targets can be placed at certain risk-reward levels. In this case, we just use 1:1 for the bullish (trend side) and 1:1.5 for the bearish side (reversal side)
In this case, the price hit the target without any issues:
Once trade is complete, wait for next reversal signal to appear before placing another order :)
Comments