Discounted Price Probability Indicator
This article delves into the probability of discounted stock prices by leveraging historical price and fundamental correlations. The script utilizes advanced features of Pine, such as matrices, and the new functionalities of tables, including cell merge and tooltips, to achieve this analysis.
Link to the Indicator : Discounted Price Probability
The Probability Measurement Process
The probability is measured from two perspectives:
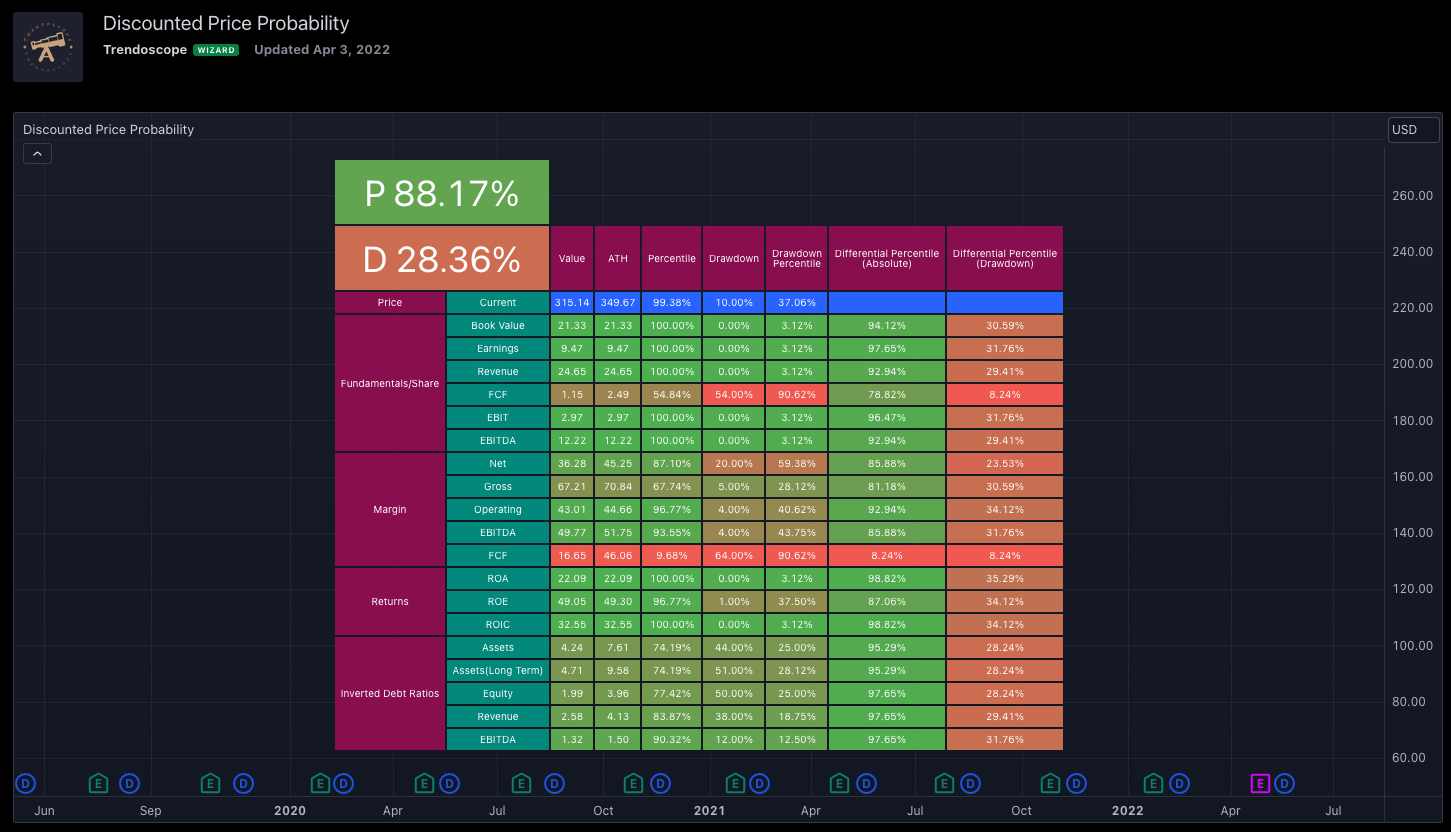
- Absolute Probability: This involves comparing the percentile of both price and fundamentals with respect to their all-time highs. The difference between the two percentiles indicates the likelihood of a stock being undervalued.
- Drawdown Probability: In this approach, the distance from the all-time high is measured for both price and fundamentals. The difference between the drawdown percentiles reflects the probability of a stock being undervalued.
Components Overview
The statistics presented in the analysis can be summarized as follows:
Indicator takes into consideration following aspects
- Price
- Current
- At last earnings
- Fundamental metrics
- Book Value
- Earnings
- Revenue
- Cash Flow
- EBIT
- EBITDA
- Operating Margins
- Returns
- Debts, Assets and Equity
Value of these metrics are measured across timeline to derive current percentile, drawdown and current drawdown percentile. Difference between the max percentile of Absolute and drawdown are used for representing the value probability.
This method does not take into consideration external factors including political, geographical or recent news events. This methodology is designed purely to perform quantitative analysis based on the publicly available financial data of stocks.
Indicator Settings
Indicator settings are straighforward and it allows users to select or exclude criteria for calculations.
How to Interpret the Stats
To better understand the statistics, consider the following steps:
Observe Fundamental Values: Are most of the fundamental values highlighted in green? If so, it indicates that they are close to their all-time highs in terms of percentile.
Analyze Drawdowns of Fundamental Values: Check if the drawdowns of fundamental values are highlighted in green. A positive sign suggests that the stock has not experienced significant drawdowns in fundamentals from its peak.
Examine Drawdown Percentiles: Are the percentile values of drawdowns in green? If yes, it suggests that the drop in fundamentals is not substantial compared to its previous values.
Evaluate Overall Picture: If the above observations are predominantly positive (green), it indicates that the company is experiencing strong growth. Example: TSLA
Consider Quality Amid Probabilities: However, keep in mind that even if the probability of being undervalued is high, like in the case of NKLA, it may not guarantee the stock's overall quality. Some stocks may show higher undervaluation probabilities due to consistently lower fundamental performance.
Comments