Crypto Volume Strength Comparator
Here is an attempt to perform a comparative analysis between top cryptos based on strength (oscillator) and volume. The methodology used here is similar to the Magic Number formula described in the post: Enhanced Magic Formula for fundamental analysis. But, instead of using fundamentals, we are making use of a few technicals to derive similar outcomes. Usage of the available stats will not be the same as the Magic number since we are using technicals.
Link to the Indicator: Crypto Volume Strength Comparator
Volume Strength Magic Number
Here is the summary of the process followed to derive the crypto volume strength comparison indicator using the Magic Number methodology.
- Get crypto exchange based on the prefix of the instrument being used.
- For the given exchange, get data for all the tickers available in input fields.
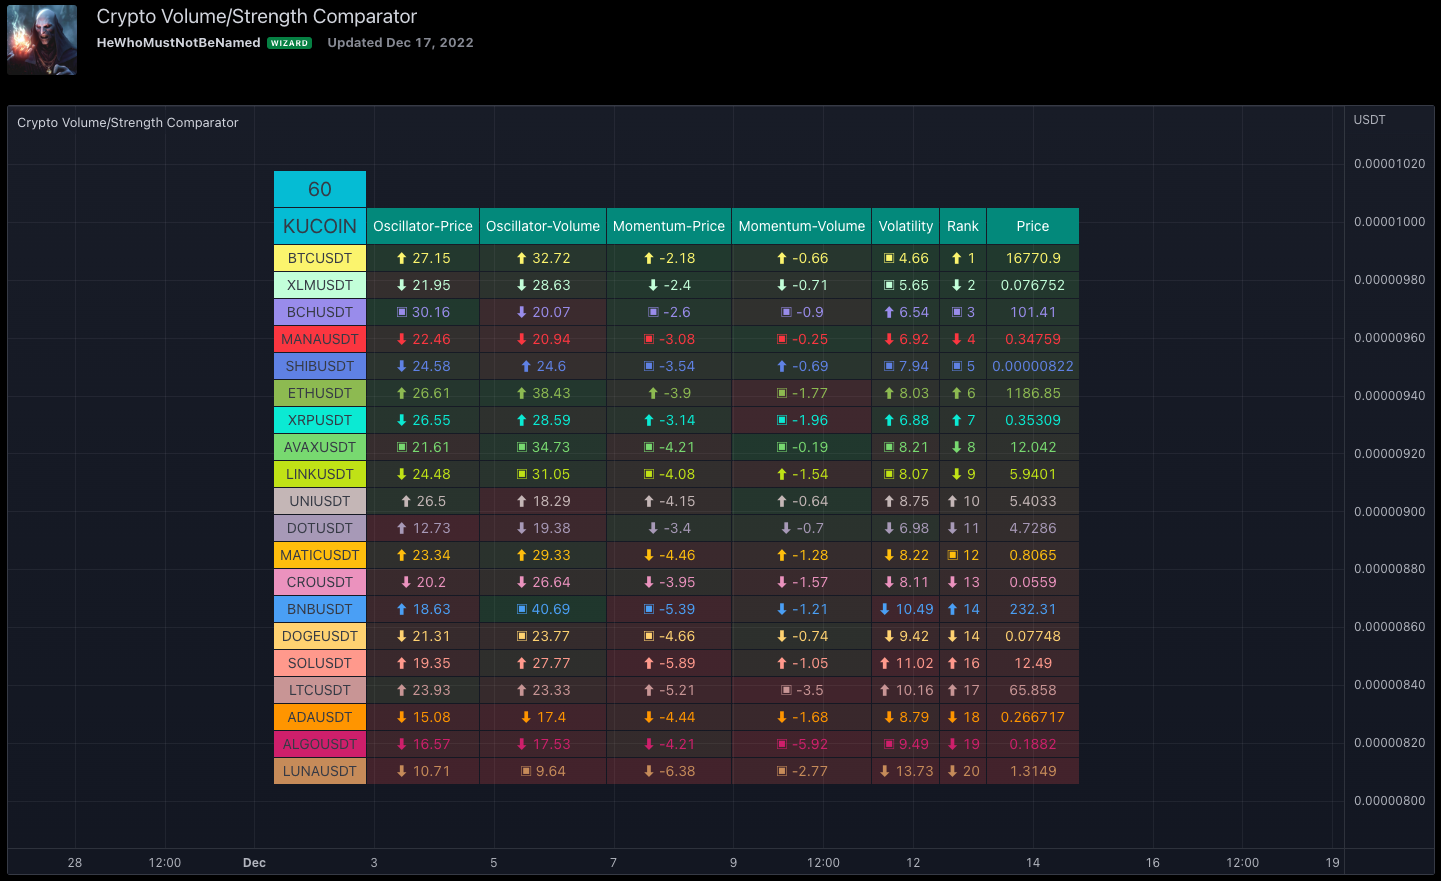
- Calculate Oscillator, and Momentum based on the price for each ticker.
- Calculate the Oscillator, Momentum based on volume for each ticker.
- Calculate the Volatility for each ticker.
- Rank Price-Oscillator, Price-Momentum, Volume-Oscillator, Volume-Momentum, and Volatility for each ticker.
- Calculate combined rank by adding up individual ranks.
- Calculate the movement of rankings from bar to bar
- Sort tickers based on rank and populate them on the table. Display the direction of rankings.
Chart Components of Volume Strength Comparator
Display components are as follows.
Settings of the Comparator Indicator
Settings are pretty simple and straightforward
Calculations
- Oscillators: High values of oscillators are considered as ideal as the process is intended towards finding a trend.
- Momentum: Momentum is calculated on the basis of the Squeeze Momentum Indicator by @LazyBear.
- Volatility: Volatility is calculated on the basis of the Williams Vix Fix by @ChrisMoody. Here too since we are in trend-following mode, a lower Vix fix is considered ideal.
Notes
- Tickers will show data only if the selected exchange has them. Some tickers are not available in all exchanges. In that case, it will show NAN. This is kind of unavoidable as we need to have fixed-size arrays for any calculations.
- Indicator works only on crypto tickers which have valid exchange.
- Tickers move through the rankings in real-time. The background of all stats is based on a gradient from green to red.
- Tickers on top may not always have the better long opportunity or tickers at the bottom may not always be optimal for shorting. We need to consider how long the instrument may stay in its position or how fast it is moving in the opposite direction. Hence, directions of the ranking movement are also shown in the table.
Comments